Crow vs Houma Associate's Degree
COMPARE
Crow
Houma
Associate's Degree
Associate's Degree Comparison
Crow
Houma
37.6%
ASSOCIATE'S DEGREE
0.0/ 100
METRIC RATING
316th/ 347
METRIC RANK
28.2%
ASSOCIATE'S DEGREE
0.0/ 100
METRIC RATING
346th/ 347
METRIC RANK
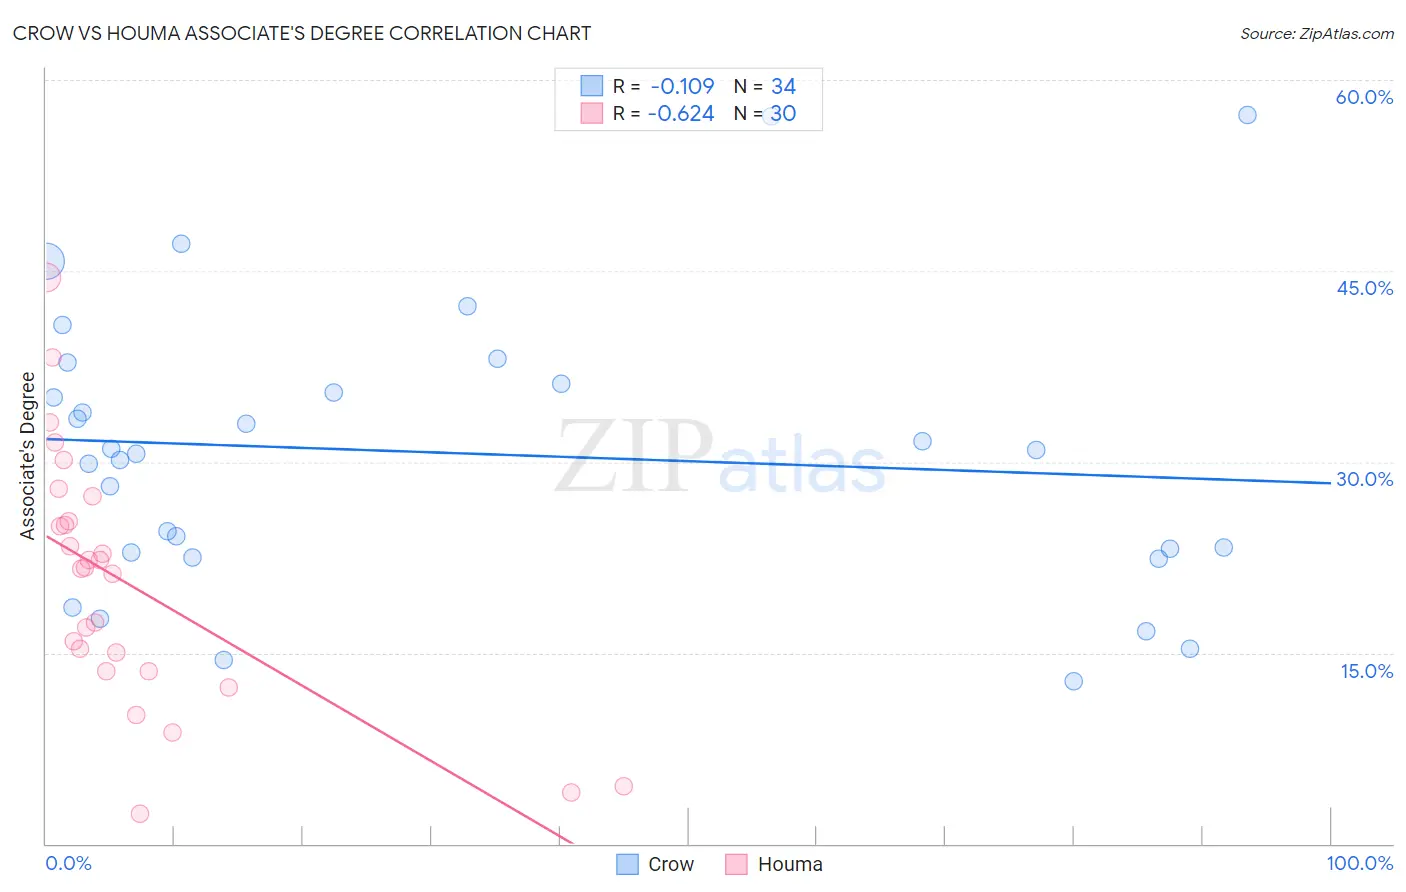
Crow vs Houma Associate's Degree Correlation Chart
The statistical analysis conducted on geographies consisting of 59,209,492 people shows a poor negative correlation between the proportion of Crow and percentage of population with at least associate's degree education in the United States with a correlation coefficient (R) of -0.109 and weighted average of 37.6%. Similarly, the statistical analysis conducted on geographies consisting of 36,792,820 people shows a significant negative correlation between the proportion of Houma and percentage of population with at least associate's degree education in the United States with a correlation coefficient (R) of -0.624 and weighted average of 28.2%, a difference of 33.2%.
Associate's Degree Correlation Summary
| Measurement | Crow | Houma |
| Minimum | 12.8% | 2.4% |
| Maximum | 57.2% | 44.5% |
| Range | 44.4% | 42.2% |
| Mean | 30.7% | 20.4% |
| Median | 30.8% | 21.7% |
| Interquartile 25% (IQ1) | 22.8% | 13.5% |
| Interquartile 75% (IQ3) | 36.1% | 25.3% |
| Interquartile Range (IQR) | 13.3% | 11.8% |
| Standard Deviation (Sample) | 11.1% | 9.9% |
| Standard Deviation (Population) | 10.9% | 9.7% |
Similar Demographics by Associate's Degree
Demographics Similar to Crow by Associate's Degree
In terms of associate's degree, the demographic groups most similar to Crow are Creek (37.6%, a difference of 0.010%), Yaqui (37.6%, a difference of 0.020%), Alaska Native (37.5%, a difference of 0.25%), Seminole (37.7%, a difference of 0.40%), and Hispanic or Latino (37.7%, a difference of 0.45%).
| Demographics | Rating | Rank | Associate's Degree |
| Immigrants | Guatemala | 0.0 /100 | #309 | Tragic 38.1% |
| Immigrants | Dominican Republic | 0.0 /100 | #310 | Tragic 37.9% |
| Immigrants | Latin America | 0.0 /100 | #311 | Tragic 37.9% |
| Choctaw | 0.0 /100 | #312 | Tragic 37.8% |
| Hispanics or Latinos | 0.0 /100 | #313 | Tragic 37.7% |
| Seminole | 0.0 /100 | #314 | Tragic 37.7% |
| Creek | 0.0 /100 | #315 | Tragic 37.6% |
| Crow | 0.0 /100 | #316 | Tragic 37.6% |
| Yaqui | 0.0 /100 | #317 | Tragic 37.6% |
| Alaska Natives | 0.0 /100 | #318 | Tragic 37.5% |
| Fijians | 0.0 /100 | #319 | Tragic 37.4% |
| Cajuns | 0.0 /100 | #320 | Tragic 37.4% |
| Immigrants | Yemen | 0.0 /100 | #321 | Tragic 37.3% |
| Pennsylvania Germans | 0.0 /100 | #322 | Tragic 37.2% |
| Immigrants | Cabo Verde | 0.0 /100 | #323 | Tragic 36.8% |
Demographics Similar to Houma by Associate's Degree
In terms of associate's degree, the demographic groups most similar to Houma are Pima (30.2%, a difference of 7.2%), Yuman (31.3%, a difference of 10.8%), Tohono O'odham (31.8%, a difference of 12.7%), Yup'ik (25.0%, a difference of 13.0%), and Yakama (32.3%, a difference of 14.6%).
| Demographics | Rating | Rank | Associate's Degree |
| Mexicans | 0.0 /100 | #333 | Tragic 35.0% |
| Natives/Alaskans | 0.0 /100 | #334 | Tragic 34.9% |
| Spanish American Indians | 0.0 /100 | #335 | Tragic 34.9% |
| Hopi | 0.0 /100 | #336 | Tragic 34.6% |
| Lumbee | 0.0 /100 | #337 | Tragic 34.1% |
| Pueblo | 0.0 /100 | #338 | Tragic 34.0% |
| Immigrants | Mexico | 0.0 /100 | #339 | Tragic 33.7% |
| Navajo | 0.0 /100 | #340 | Tragic 32.6% |
| Inupiat | 0.0 /100 | #341 | Tragic 32.6% |
| Yakama | 0.0 /100 | #342 | Tragic 32.3% |
| Tohono O'odham | 0.0 /100 | #343 | Tragic 31.8% |
| Yuman | 0.0 /100 | #344 | Tragic 31.3% |
| Pima | 0.0 /100 | #345 | Tragic 30.2% |
| Houma | 0.0 /100 | #346 | Tragic 28.2% |
| Yup'ik | 0.0 /100 | #347 | Tragic 25.0% |