Panamanian vs Tohono O'odham Master's Degree
COMPARE
Panamanian
Tohono O'odham
Master's Degree
Master's Degree Comparison
Panamanians
Tohono O'odham
14.4%
MASTER'S DEGREE
25.1/ 100
METRIC RATING
200th/ 347
METRIC RANK
9.7%
MASTER'S DEGREE
0.0/ 100
METRIC RATING
338th/ 347
METRIC RANK
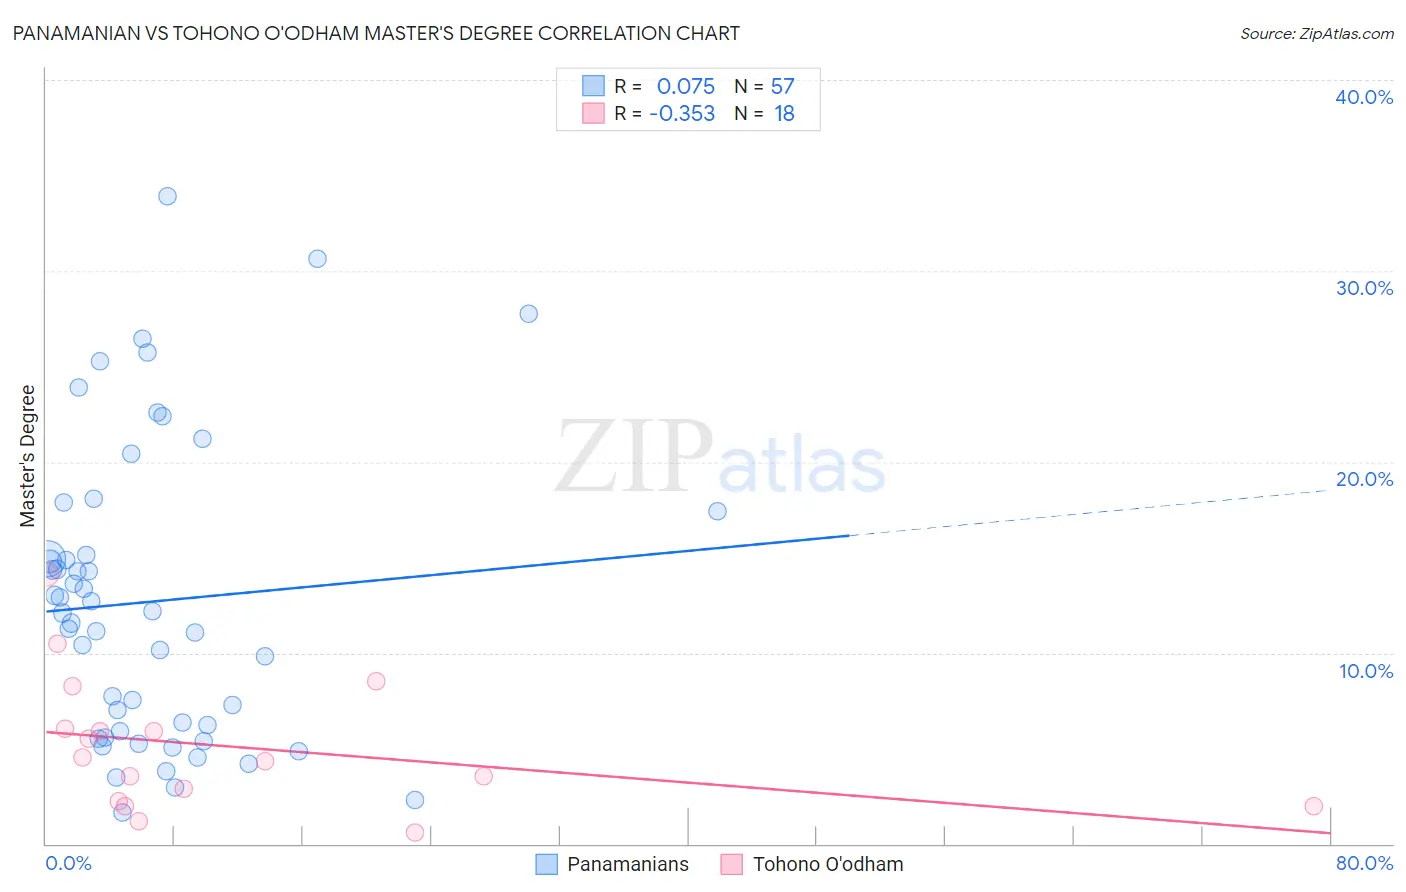
Panamanian vs Tohono O'odham Master's Degree Correlation Chart
The statistical analysis conducted on geographies consisting of 281,151,832 people shows a slight positive correlation between the proportion of Panamanians and percentage of population with at least master's degree education in the United States with a correlation coefficient (R) of 0.075 and weighted average of 14.4%. Similarly, the statistical analysis conducted on geographies consisting of 58,714,512 people shows a mild negative correlation between the proportion of Tohono O'odham and percentage of population with at least master's degree education in the United States with a correlation coefficient (R) of -0.353 and weighted average of 9.7%, a difference of 48.3%.
Master's Degree Correlation Summary
| Measurement | Panamanian | Tohono O'odham |
| Minimum | 1.6% | 0.61% |
| Maximum | 33.9% | 14.1% |
| Range | 32.3% | 13.5% |
| Mean | 12.7% | 5.1% |
| Median | 12.1% | 4.4% |
| Interquartile 25% (IQ1) | 5.7% | 2.3% |
| Interquartile 75% (IQ3) | 16.3% | 6.0% |
| Interquartile Range (IQR) | 10.5% | 3.7% |
| Standard Deviation (Sample) | 7.8% | 3.5% |
| Standard Deviation (Population) | 7.7% | 3.4% |
Similar Demographics by Master's Degree
Demographics Similar to Panamanians by Master's Degree
In terms of master's degree, the demographic groups most similar to Panamanians are Scotch-Irish (14.4%, a difference of 0.010%), Immigrants from Western Africa (14.4%, a difference of 0.020%), Yugoslavian (14.4%, a difference of 0.13%), French (14.4%, a difference of 0.25%), and Trinidadian and Tobagonian (14.4%, a difference of 0.28%).
| Demographics | Rating | Rank | Master's Degree |
| Immigrants | Nigeria | 32.7 /100 | #193 | Fair 14.6% |
| Chinese | 32.5 /100 | #194 | Fair 14.6% |
| Danes | 31.3 /100 | #195 | Fair 14.5% |
| Czechoslovakians | 29.9 /100 | #196 | Fair 14.5% |
| Belgians | 28.0 /100 | #197 | Fair 14.5% |
| West Indians | 27.4 /100 | #198 | Fair 14.5% |
| Immigrants | Armenia | 27.2 /100 | #199 | Fair 14.5% |
| Panamanians | 25.1 /100 | #200 | Fair 14.4% |
| Scotch-Irish | 25.0 /100 | #201 | Fair 14.4% |
| Immigrants | Western Africa | 24.9 /100 | #202 | Fair 14.4% |
| Yugoslavians | 24.3 /100 | #203 | Fair 14.4% |
| French | 23.7 /100 | #204 | Fair 14.4% |
| Trinidadians and Tobagonians | 23.5 /100 | #205 | Fair 14.4% |
| Scandinavians | 23.3 /100 | #206 | Fair 14.4% |
| Immigrants | Bosnia and Herzegovina | 22.0 /100 | #207 | Fair 14.3% |
Demographics Similar to Tohono O'odham by Master's Degree
In terms of master's degree, the demographic groups most similar to Tohono O'odham are Mexican (9.7%, a difference of 0.080%), Spanish American Indian (9.6%, a difference of 1.3%), Native/Alaskan (9.9%, a difference of 2.3%), Yakama (9.5%, a difference of 2.6%), and Immigrants from Central America (10.0%, a difference of 2.9%).
| Demographics | Rating | Rank | Master's Degree |
| Pueblo | 0.0 /100 | #331 | Tragic 10.3% |
| Immigrants | Azores | 0.0 /100 | #332 | Tragic 10.2% |
| Menominee | 0.0 /100 | #333 | Tragic 10.2% |
| Arapaho | 0.0 /100 | #334 | Tragic 10.0% |
| Immigrants | Central America | 0.0 /100 | #335 | Tragic 10.0% |
| Natives/Alaskans | 0.0 /100 | #336 | Tragic 9.9% |
| Mexicans | 0.0 /100 | #337 | Tragic 9.7% |
| Tohono O'odham | 0.0 /100 | #338 | Tragic 9.7% |
| Spanish American Indians | 0.0 /100 | #339 | Tragic 9.6% |
| Yakama | 0.0 /100 | #340 | Tragic 9.5% |
| Navajo | 0.0 /100 | #341 | Tragic 9.4% |
| Immigrants | Mexico | 0.0 /100 | #342 | Tragic 9.3% |
| Lumbee | 0.0 /100 | #343 | Tragic 9.3% |
| Pima | 0.0 /100 | #344 | Tragic 9.2% |
| Yuman | 0.0 /100 | #345 | Tragic 9.2% |