Immigrants from Kuwait vs Tohono O'odham Master's Degree
COMPARE
Immigrants from Kuwait
Tohono O'odham
Master's Degree
Master's Degree Comparison
Immigrants from Kuwait
Tohono O'odham
18.6%
MASTER'S DEGREE
100.0/ 100
METRIC RATING
52nd/ 347
METRIC RANK
9.7%
MASTER'S DEGREE
0.0/ 100
METRIC RATING
338th/ 347
METRIC RANK
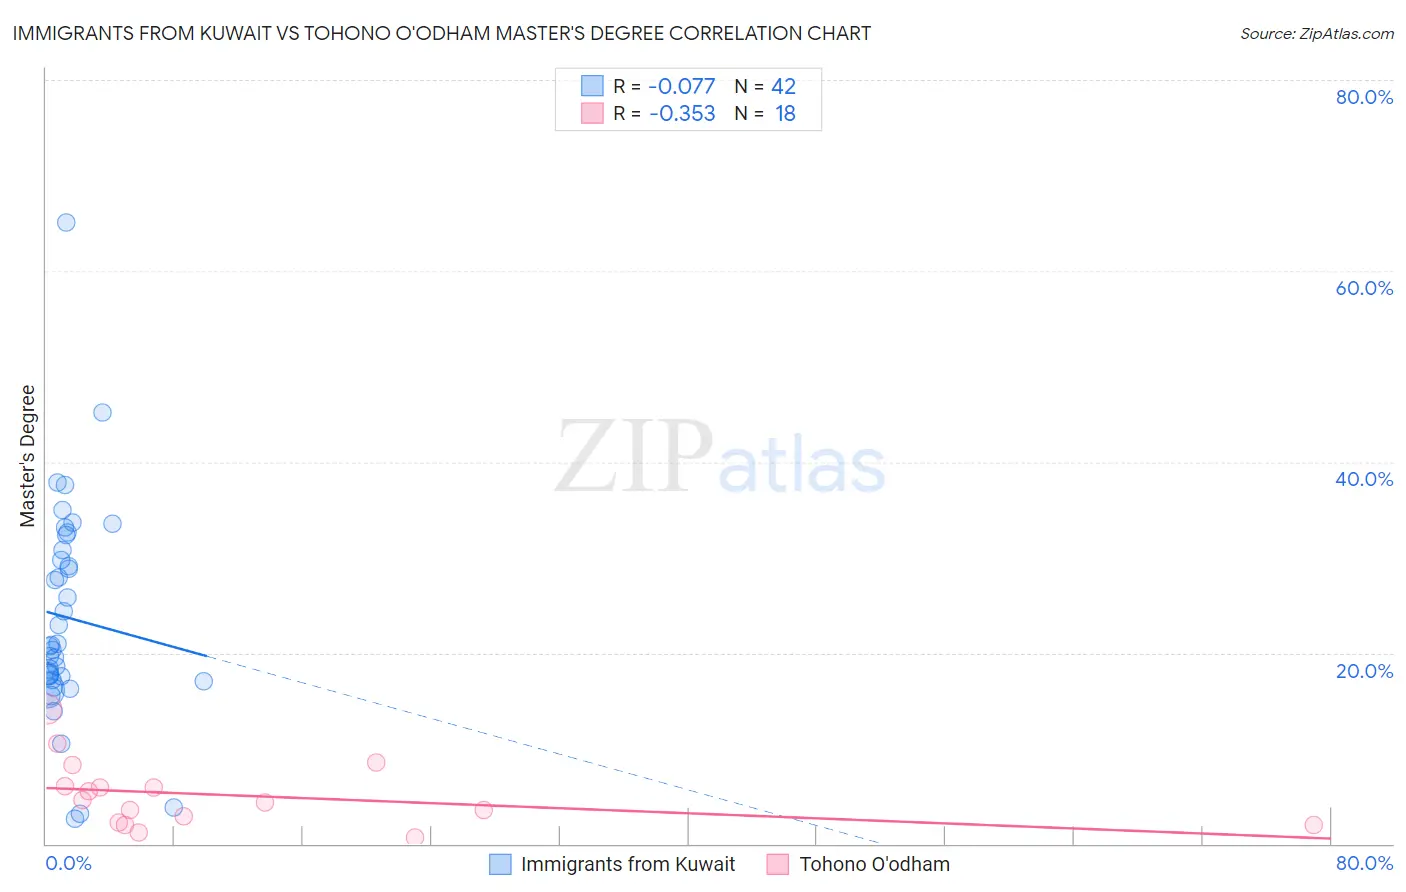
Immigrants from Kuwait vs Tohono O'odham Master's Degree Correlation Chart
The statistical analysis conducted on geographies consisting of 136,916,630 people shows a slight negative correlation between the proportion of Immigrants from Kuwait and percentage of population with at least master's degree education in the United States with a correlation coefficient (R) of -0.077 and weighted average of 18.6%. Similarly, the statistical analysis conducted on geographies consisting of 58,714,512 people shows a mild negative correlation between the proportion of Tohono O'odham and percentage of population with at least master's degree education in the United States with a correlation coefficient (R) of -0.353 and weighted average of 9.7%, a difference of 91.3%.
Master's Degree Correlation Summary
| Measurement | Immigrants from Kuwait | Tohono O'odham |
| Minimum | 2.6% | 0.61% |
| Maximum | 65.1% | 14.1% |
| Range | 62.5% | 13.5% |
| Mean | 23.7% | 5.1% |
| Median | 20.7% | 4.4% |
| Interquartile 25% (IQ1) | 17.1% | 2.3% |
| Interquartile 75% (IQ3) | 30.8% | 6.0% |
| Interquartile Range (IQR) | 13.7% | 3.7% |
| Standard Deviation (Sample) | 11.5% | 3.5% |
| Standard Deviation (Population) | 11.4% | 3.4% |
Similar Demographics by Master's Degree
Demographics Similar to Immigrants from Kuwait by Master's Degree
In terms of master's degree, the demographic groups most similar to Immigrants from Kuwait are Immigrants from Czechoslovakia (18.5%, a difference of 0.080%), Immigrants from Lithuania (18.5%, a difference of 0.39%), Immigrants from Serbia (18.5%, a difference of 0.42%), Asian (18.4%, a difference of 0.65%), and Immigrants from Asia (18.4%, a difference of 0.79%).
| Demographics | Rating | Rank | Master's Degree |
| Immigrants | Belarus | 100.0 /100 | #45 | Exceptional 18.9% |
| Immigrants | Norway | 100.0 /100 | #46 | Exceptional 18.8% |
| Immigrants | Austria | 100.0 /100 | #47 | Exceptional 18.8% |
| Paraguayans | 100.0 /100 | #48 | Exceptional 18.8% |
| Estonians | 100.0 /100 | #49 | Exceptional 18.8% |
| Bulgarians | 100.0 /100 | #50 | Exceptional 18.8% |
| Immigrants | South Africa | 100.0 /100 | #51 | Exceptional 18.8% |
| Immigrants | Kuwait | 100.0 /100 | #52 | Exceptional 18.6% |
| Immigrants | Czechoslovakia | 99.9 /100 | #53 | Exceptional 18.5% |
| Immigrants | Lithuania | 99.9 /100 | #54 | Exceptional 18.5% |
| Immigrants | Serbia | 99.9 /100 | #55 | Exceptional 18.5% |
| Asians | 99.9 /100 | #56 | Exceptional 18.4% |
| Immigrants | Asia | 99.9 /100 | #57 | Exceptional 18.4% |
| Australians | 99.9 /100 | #58 | Exceptional 18.4% |
| Immigrants | Bulgaria | 99.9 /100 | #59 | Exceptional 18.3% |
Demographics Similar to Tohono O'odham by Master's Degree
In terms of master's degree, the demographic groups most similar to Tohono O'odham are Mexican (9.7%, a difference of 0.080%), Spanish American Indian (9.6%, a difference of 1.3%), Native/Alaskan (9.9%, a difference of 2.3%), Yakama (9.5%, a difference of 2.6%), and Immigrants from Central America (10.0%, a difference of 2.9%).
| Demographics | Rating | Rank | Master's Degree |
| Pueblo | 0.0 /100 | #331 | Tragic 10.3% |
| Immigrants | Azores | 0.0 /100 | #332 | Tragic 10.2% |
| Menominee | 0.0 /100 | #333 | Tragic 10.2% |
| Arapaho | 0.0 /100 | #334 | Tragic 10.0% |
| Immigrants | Central America | 0.0 /100 | #335 | Tragic 10.0% |
| Natives/Alaskans | 0.0 /100 | #336 | Tragic 9.9% |
| Mexicans | 0.0 /100 | #337 | Tragic 9.7% |
| Tohono O'odham | 0.0 /100 | #338 | Tragic 9.7% |
| Spanish American Indians | 0.0 /100 | #339 | Tragic 9.6% |
| Yakama | 0.0 /100 | #340 | Tragic 9.5% |
| Navajo | 0.0 /100 | #341 | Tragic 9.4% |
| Immigrants | Mexico | 0.0 /100 | #342 | Tragic 9.3% |
| Lumbee | 0.0 /100 | #343 | Tragic 9.3% |
| Pima | 0.0 /100 | #344 | Tragic 9.2% |
| Yuman | 0.0 /100 | #345 | Tragic 9.2% |