Immigrants from Syria vs Tohono O'odham Master's Degree
COMPARE
Immigrants from Syria
Tohono O'odham
Master's Degree
Master's Degree Comparison
Immigrants from Syria
Tohono O'odham
16.2%
MASTER'S DEGREE
93.3/ 100
METRIC RATING
129th/ 347
METRIC RANK
9.7%
MASTER'S DEGREE
0.0/ 100
METRIC RATING
338th/ 347
METRIC RANK
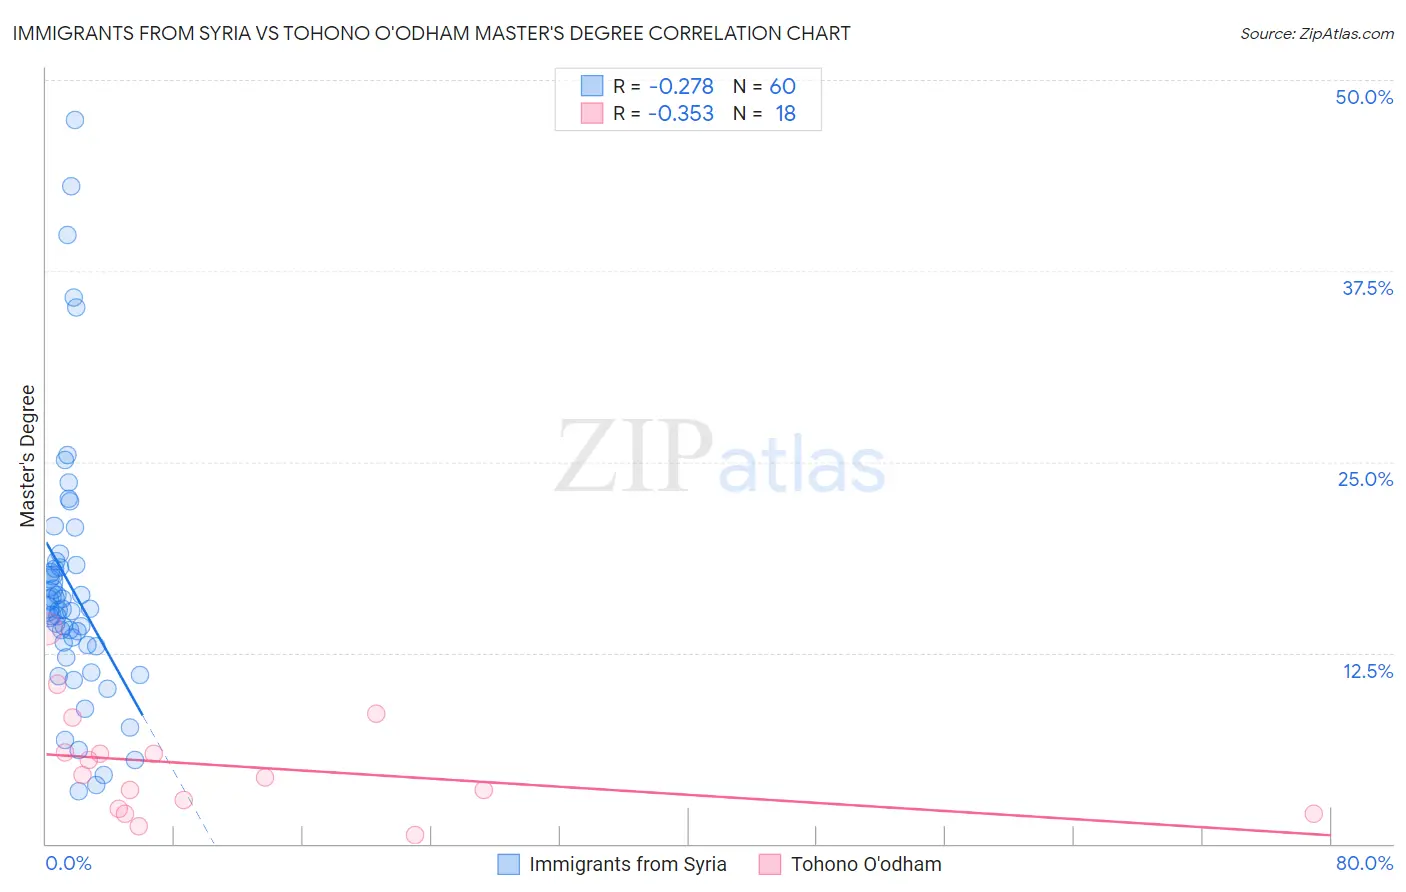
Immigrants from Syria vs Tohono O'odham Master's Degree Correlation Chart
The statistical analysis conducted on geographies consisting of 174,107,928 people shows a weak negative correlation between the proportion of Immigrants from Syria and percentage of population with at least master's degree education in the United States with a correlation coefficient (R) of -0.278 and weighted average of 16.2%. Similarly, the statistical analysis conducted on geographies consisting of 58,714,512 people shows a mild negative correlation between the proportion of Tohono O'odham and percentage of population with at least master's degree education in the United States with a correlation coefficient (R) of -0.353 and weighted average of 9.7%, a difference of 66.6%.
Master's Degree Correlation Summary
| Measurement | Immigrants from Syria | Tohono O'odham |
| Minimum | 3.4% | 0.61% |
| Maximum | 47.4% | 14.1% |
| Range | 44.0% | 13.5% |
| Mean | 16.8% | 5.1% |
| Median | 15.3% | 4.4% |
| Interquartile 25% (IQ1) | 13.0% | 2.3% |
| Interquartile 75% (IQ3) | 18.2% | 6.0% |
| Interquartile Range (IQR) | 5.2% | 3.7% |
| Standard Deviation (Sample) | 8.7% | 3.5% |
| Standard Deviation (Population) | 8.6% | 3.4% |
Similar Demographics by Master's Degree
Demographics Similar to Immigrants from Syria by Master's Degree
In terms of master's degree, the demographic groups most similar to Immigrants from Syria are Immigrants from Jordan (16.1%, a difference of 0.26%), Taiwanese (16.1%, a difference of 0.58%), Serbian (16.1%, a difference of 0.67%), Immigrants from Sierra Leone (16.3%, a difference of 0.75%), and Palestinian (16.3%, a difference of 0.80%).
| Demographics | Rating | Rank | Master's Degree |
| British | 95.6 /100 | #122 | Exceptional 16.4% |
| Croatians | 95.6 /100 | #123 | Exceptional 16.4% |
| Immigrants | Eritrea | 95.5 /100 | #124 | Exceptional 16.4% |
| Italians | 95.4 /100 | #125 | Exceptional 16.4% |
| Immigrants | Eastern Africa | 95.2 /100 | #126 | Exceptional 16.3% |
| Palestinians | 94.8 /100 | #127 | Exceptional 16.3% |
| Immigrants | Sierra Leone | 94.7 /100 | #128 | Exceptional 16.3% |
| Immigrants | Syria | 93.3 /100 | #129 | Exceptional 16.2% |
| Immigrants | Jordan | 92.7 /100 | #130 | Exceptional 16.1% |
| Taiwanese | 91.9 /100 | #131 | Exceptional 16.1% |
| Serbians | 91.7 /100 | #132 | Exceptional 16.1% |
| Immigrants | Sudan | 90.2 /100 | #133 | Exceptional 16.0% |
| Venezuelans | 88.4 /100 | #134 | Excellent 15.9% |
| South American Indians | 88.4 /100 | #135 | Excellent 15.9% |
| Assyrians/Chaldeans/Syriacs | 86.8 /100 | #136 | Excellent 15.8% |
Demographics Similar to Tohono O'odham by Master's Degree
In terms of master's degree, the demographic groups most similar to Tohono O'odham are Mexican (9.7%, a difference of 0.080%), Spanish American Indian (9.6%, a difference of 1.3%), Native/Alaskan (9.9%, a difference of 2.3%), Yakama (9.5%, a difference of 2.6%), and Immigrants from Central America (10.0%, a difference of 2.9%).
| Demographics | Rating | Rank | Master's Degree |
| Pueblo | 0.0 /100 | #331 | Tragic 10.3% |
| Immigrants | Azores | 0.0 /100 | #332 | Tragic 10.2% |
| Menominee | 0.0 /100 | #333 | Tragic 10.2% |
| Arapaho | 0.0 /100 | #334 | Tragic 10.0% |
| Immigrants | Central America | 0.0 /100 | #335 | Tragic 10.0% |
| Natives/Alaskans | 0.0 /100 | #336 | Tragic 9.9% |
| Mexicans | 0.0 /100 | #337 | Tragic 9.7% |
| Tohono O'odham | 0.0 /100 | #338 | Tragic 9.7% |
| Spanish American Indians | 0.0 /100 | #339 | Tragic 9.6% |
| Yakama | 0.0 /100 | #340 | Tragic 9.5% |
| Navajo | 0.0 /100 | #341 | Tragic 9.4% |
| Immigrants | Mexico | 0.0 /100 | #342 | Tragic 9.3% |
| Lumbee | 0.0 /100 | #343 | Tragic 9.3% |
| Pima | 0.0 /100 | #344 | Tragic 9.2% |
| Yuman | 0.0 /100 | #345 | Tragic 9.2% |