Northern European vs Tohono O'odham Master's Degree
COMPARE
Northern European
Tohono O'odham
Master's Degree
Master's Degree Comparison
Northern Europeans
Tohono O'odham
16.7%
MASTER'S DEGREE
97.6/ 100
METRIC RATING
114th/ 347
METRIC RANK
9.7%
MASTER'S DEGREE
0.0/ 100
METRIC RATING
338th/ 347
METRIC RANK
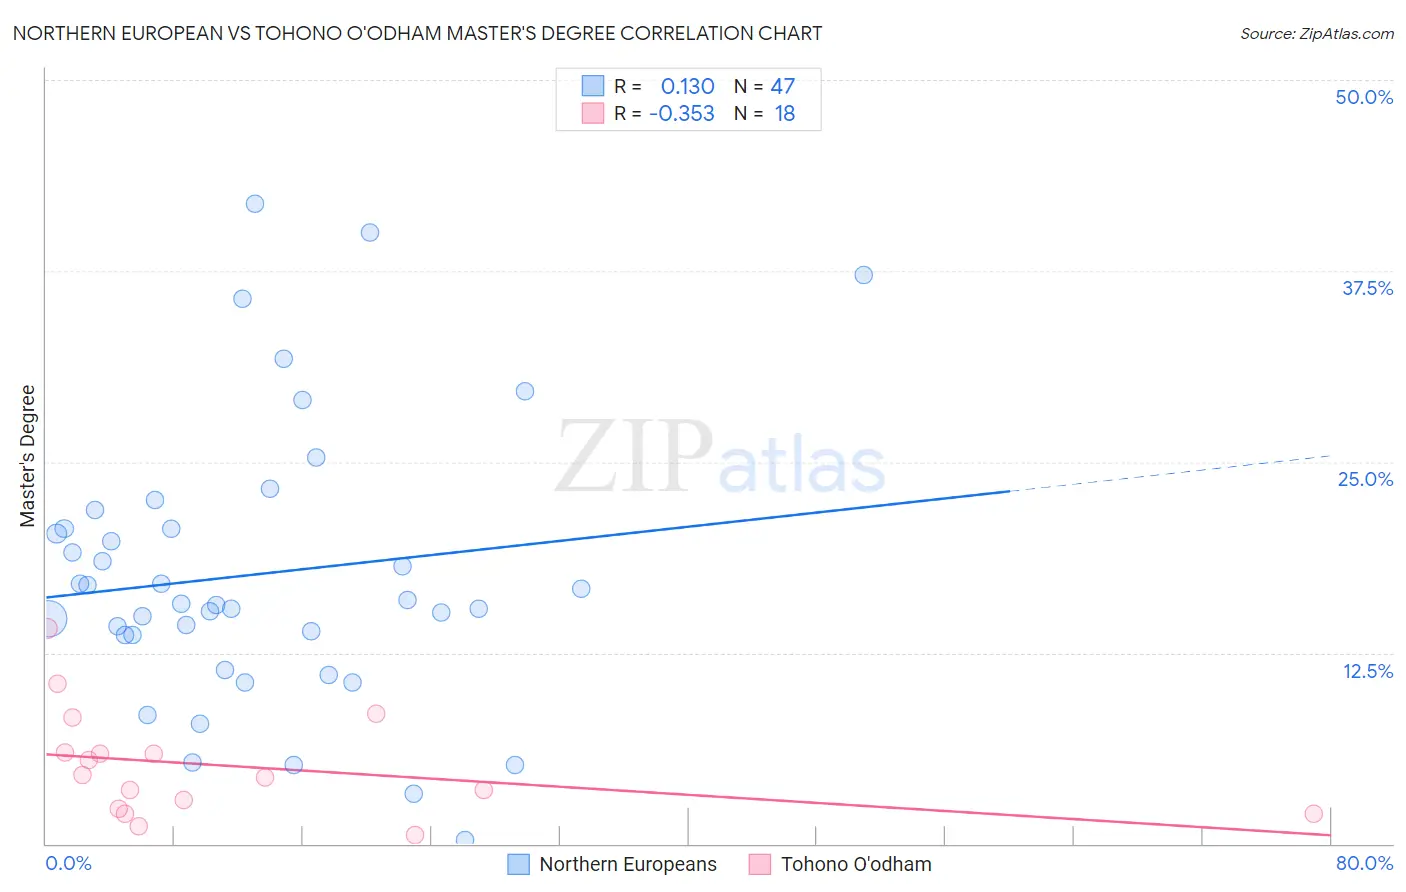
Northern European vs Tohono O'odham Master's Degree Correlation Chart
The statistical analysis conducted on geographies consisting of 406,008,564 people shows a poor positive correlation between the proportion of Northern Europeans and percentage of population with at least master's degree education in the United States with a correlation coefficient (R) of 0.130 and weighted average of 16.7%. Similarly, the statistical analysis conducted on geographies consisting of 58,714,512 people shows a mild negative correlation between the proportion of Tohono O'odham and percentage of population with at least master's degree education in the United States with a correlation coefficient (R) of -0.353 and weighted average of 9.7%, a difference of 72.0%.
Master's Degree Correlation Summary
| Measurement | Northern European | Tohono O'odham |
| Minimum | 0.22% | 0.61% |
| Maximum | 41.9% | 14.1% |
| Range | 41.7% | 13.5% |
| Mean | 17.7% | 5.1% |
| Median | 15.7% | 4.4% |
| Interquartile 25% (IQ1) | 13.7% | 2.3% |
| Interquartile 75% (IQ3) | 20.7% | 6.0% |
| Interquartile Range (IQR) | 7.0% | 3.7% |
| Standard Deviation (Sample) | 9.2% | 3.5% |
| Standard Deviation (Population) | 9.1% | 3.4% |
Similar Demographics by Master's Degree
Demographics Similar to Northern Europeans by Master's Degree
In terms of master's degree, the demographic groups most similar to Northern Europeans are Arab (16.7%, a difference of 0.070%), Macedonian (16.7%, a difference of 0.080%), Austrian (16.7%, a difference of 0.22%), Immigrants from Uganda (16.6%, a difference of 0.30%), and Immigrants from Southern Europe (16.6%, a difference of 0.42%).
| Demographics | Rating | Rank | Master's Degree |
| Armenians | 98.0 /100 | #107 | Exceptional 16.8% |
| Sierra Leoneans | 98.0 /100 | #108 | Exceptional 16.8% |
| Moroccans | 98.0 /100 | #109 | Exceptional 16.8% |
| Immigrants | Chile | 98.0 /100 | #110 | Exceptional 16.8% |
| Austrians | 97.8 /100 | #111 | Exceptional 16.7% |
| Macedonians | 97.7 /100 | #112 | Exceptional 16.7% |
| Arabs | 97.7 /100 | #113 | Exceptional 16.7% |
| Northern Europeans | 97.6 /100 | #114 | Exceptional 16.7% |
| Immigrants | Uganda | 97.3 /100 | #115 | Exceptional 16.6% |
| Immigrants | Southern Europe | 97.2 /100 | #116 | Exceptional 16.6% |
| Immigrants | Moldova | 97.2 /100 | #117 | Exceptional 16.6% |
| Brazilians | 96.8 /100 | #118 | Exceptional 16.5% |
| Jordanians | 96.5 /100 | #119 | Exceptional 16.5% |
| Lebanese | 96.4 /100 | #120 | Exceptional 16.5% |
| Afghans | 96.2 /100 | #121 | Exceptional 16.5% |
Demographics Similar to Tohono O'odham by Master's Degree
In terms of master's degree, the demographic groups most similar to Tohono O'odham are Mexican (9.7%, a difference of 0.080%), Spanish American Indian (9.6%, a difference of 1.3%), Native/Alaskan (9.9%, a difference of 2.3%), Yakama (9.5%, a difference of 2.6%), and Immigrants from Central America (10.0%, a difference of 2.9%).
| Demographics | Rating | Rank | Master's Degree |
| Pueblo | 0.0 /100 | #331 | Tragic 10.3% |
| Immigrants | Azores | 0.0 /100 | #332 | Tragic 10.2% |
| Menominee | 0.0 /100 | #333 | Tragic 10.2% |
| Arapaho | 0.0 /100 | #334 | Tragic 10.0% |
| Immigrants | Central America | 0.0 /100 | #335 | Tragic 10.0% |
| Natives/Alaskans | 0.0 /100 | #336 | Tragic 9.9% |
| Mexicans | 0.0 /100 | #337 | Tragic 9.7% |
| Tohono O'odham | 0.0 /100 | #338 | Tragic 9.7% |
| Spanish American Indians | 0.0 /100 | #339 | Tragic 9.6% |
| Yakama | 0.0 /100 | #340 | Tragic 9.5% |
| Navajo | 0.0 /100 | #341 | Tragic 9.4% |
| Immigrants | Mexico | 0.0 /100 | #342 | Tragic 9.3% |
| Lumbee | 0.0 /100 | #343 | Tragic 9.3% |
| Pima | 0.0 /100 | #344 | Tragic 9.2% |
| Yuman | 0.0 /100 | #345 | Tragic 9.2% |