Cree vs Immigrants from Hungary Professional Degree
COMPARE
Cree
Immigrants from Hungary
Professional Degree
Professional Degree Comparison
Cree
Immigrants from Hungary
3.9%
PROFESSIONAL DEGREE
4.3/ 100
METRIC RATING
232nd/ 347
METRIC RANK
5.5%
PROFESSIONAL DEGREE
99.9/ 100
METRIC RATING
69th/ 347
METRIC RANK
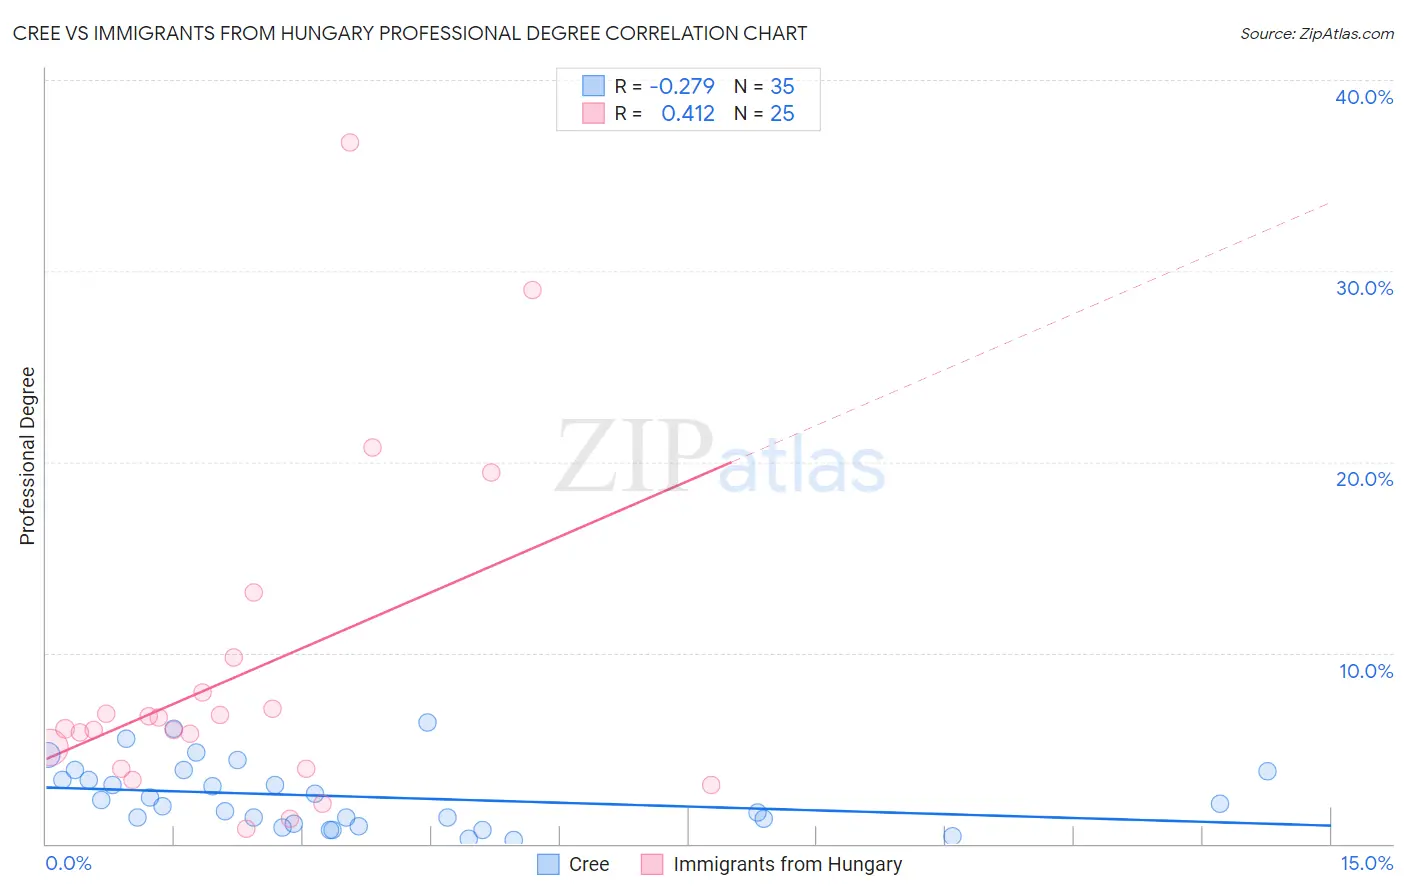
Cree vs Immigrants from Hungary Professional Degree Correlation Chart
The statistical analysis conducted on geographies consisting of 76,148,984 people shows a weak negative correlation between the proportion of Cree and percentage of population with at least professional degree education in the United States with a correlation coefficient (R) of -0.279 and weighted average of 3.9%. Similarly, the statistical analysis conducted on geographies consisting of 195,587,286 people shows a moderate positive correlation between the proportion of Immigrants from Hungary and percentage of population with at least professional degree education in the United States with a correlation coefficient (R) of 0.412 and weighted average of 5.5%, a difference of 39.5%.
Professional Degree Correlation Summary
| Measurement | Cree | Immigrants from Hungary |
| Minimum | 0.20% | 0.81% |
| Maximum | 6.3% | 36.7% |
| Range | 6.1% | 35.9% |
| Mean | 2.5% | 8.9% |
| Median | 2.1% | 6.0% |
| Interquartile 25% (IQ1) | 1.1% | 3.9% |
| Interquartile 75% (IQ3) | 3.8% | 8.8% |
| Interquartile Range (IQR) | 2.7% | 4.9% |
| Standard Deviation (Sample) | 1.7% | 8.7% |
| Standard Deviation (Population) | 1.7% | 8.5% |
Similar Demographics by Professional Degree
Demographics Similar to Cree by Professional Degree
In terms of professional degree, the demographic groups most similar to Cree are Ecuadorian (3.9%, a difference of 0.21%), Immigrants from Philippines (3.9%, a difference of 0.26%), Nonimmigrants (3.9%, a difference of 0.30%), Immigrants from Barbados (3.9%, a difference of 0.31%), and Spanish American (3.9%, a difference of 0.53%).
| Demographics | Rating | Rank | Professional Degree |
| Tlingit-Haida | 6.9 /100 | #225 | Tragic 4.0% |
| German Russians | 6.1 /100 | #226 | Tragic 4.0% |
| Cubans | 5.9 /100 | #227 | Tragic 4.0% |
| Immigrants | West Indies | 5.6 /100 | #228 | Tragic 4.0% |
| Immigrants | Burma/Myanmar | 5.4 /100 | #229 | Tragic 3.9% |
| Nicaraguans | 5.1 /100 | #230 | Tragic 3.9% |
| Ecuadorians | 4.6 /100 | #231 | Tragic 3.9% |
| Cree | 4.3 /100 | #232 | Tragic 3.9% |
| Immigrants | Philippines | 4.1 /100 | #233 | Tragic 3.9% |
| Immigrants | Nonimmigrants | 4.0 /100 | #234 | Tragic 3.9% |
| Immigrants | Barbados | 4.0 /100 | #235 | Tragic 3.9% |
| Spanish Americans | 3.8 /100 | #236 | Tragic 3.9% |
| Immigrants | Trinidad and Tobago | 3.8 /100 | #237 | Tragic 3.9% |
| Colville | 2.6 /100 | #238 | Tragic 3.8% |
| British West Indians | 2.4 /100 | #239 | Tragic 3.8% |
Demographics Similar to Immigrants from Hungary by Professional Degree
In terms of professional degree, the demographic groups most similar to Immigrants from Hungary are Immigrants from Lebanon (5.5%, a difference of 0.080%), Immigrants from Bulgaria (5.5%, a difference of 0.26%), Bhutanese (5.4%, a difference of 0.33%), Immigrants from Kazakhstan (5.5%, a difference of 0.59%), and Immigrants from Bolivia (5.5%, a difference of 0.83%).
| Demographics | Rating | Rank | Professional Degree |
| Immigrants | Belarus | 99.9 /100 | #62 | Exceptional 5.5% |
| Asians | 99.9 /100 | #63 | Exceptional 5.5% |
| Immigrants | Asia | 99.9 /100 | #64 | Exceptional 5.5% |
| Immigrants | Bolivia | 99.9 /100 | #65 | Exceptional 5.5% |
| Immigrants | Kazakhstan | 99.9 /100 | #66 | Exceptional 5.5% |
| Immigrants | Bulgaria | 99.9 /100 | #67 | Exceptional 5.5% |
| Immigrants | Lebanon | 99.9 /100 | #68 | Exceptional 5.5% |
| Immigrants | Hungary | 99.9 /100 | #69 | Exceptional 5.5% |
| Bhutanese | 99.8 /100 | #70 | Exceptional 5.4% |
| Immigrants | Western Asia | 99.8 /100 | #71 | Exceptional 5.4% |
| Lithuanians | 99.8 /100 | #72 | Exceptional 5.4% |
| Immigrants | Romania | 99.8 /100 | #73 | Exceptional 5.4% |
| Ethiopians | 99.7 /100 | #74 | Exceptional 5.4% |
| Immigrants | Indonesia | 99.7 /100 | #75 | Exceptional 5.3% |
| Immigrants | Canada | 99.7 /100 | #76 | Exceptional 5.3% |