Cree vs Aleut Professional Degree
COMPARE
Cree
Aleut
Professional Degree
Professional Degree Comparison
Cree
Aleuts
3.9%
PROFESSIONAL DEGREE
4.3/ 100
METRIC RATING
232nd/ 347
METRIC RANK
3.6%
PROFESSIONAL DEGREE
0.7/ 100
METRIC RATING
268th/ 347
METRIC RANK
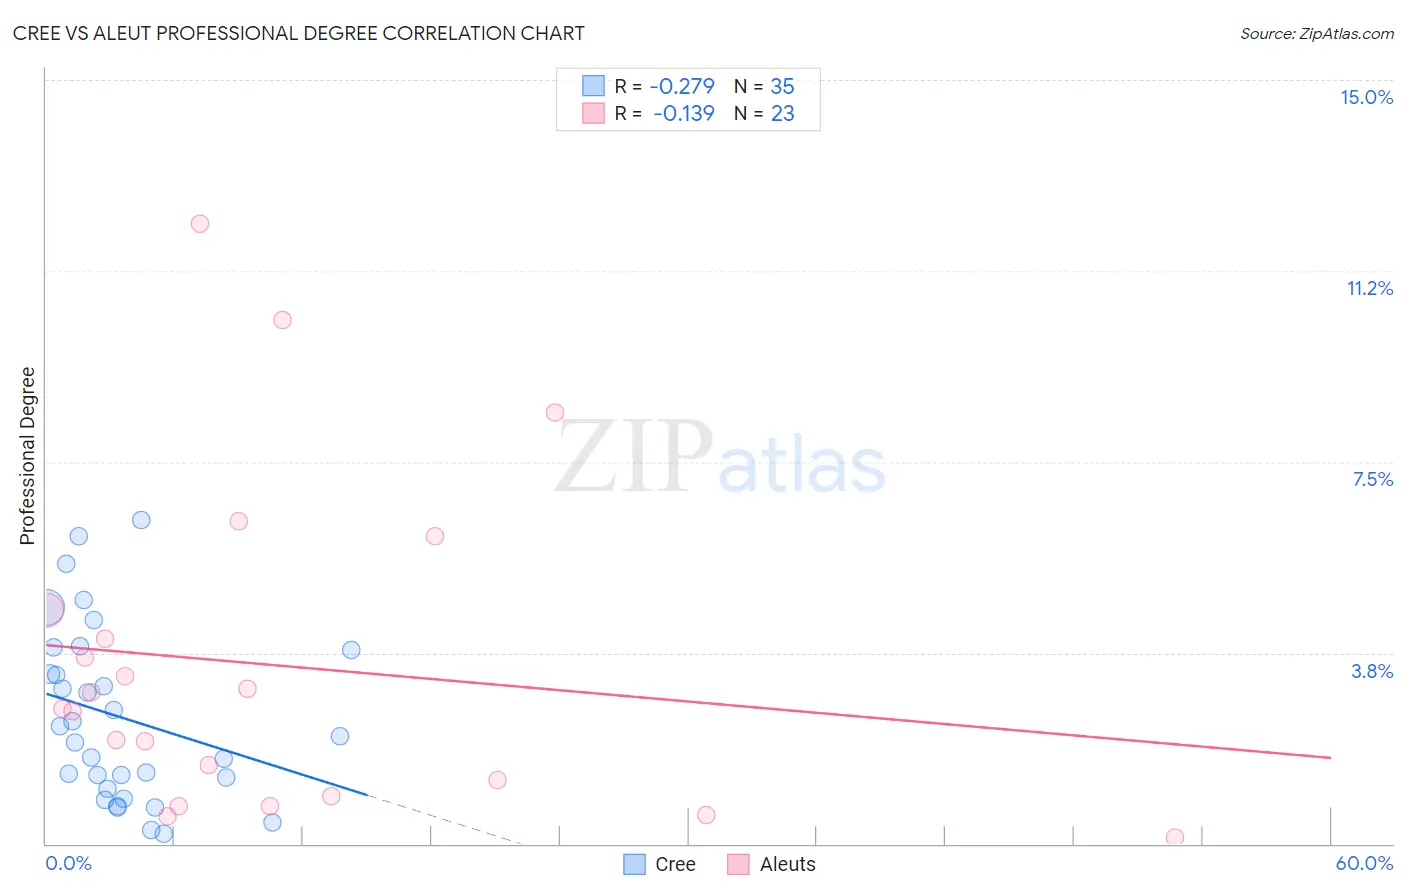
Cree vs Aleut Professional Degree Correlation Chart
The statistical analysis conducted on geographies consisting of 76,148,984 people shows a weak negative correlation between the proportion of Cree and percentage of population with at least professional degree education in the United States with a correlation coefficient (R) of -0.279 and weighted average of 3.9%. Similarly, the statistical analysis conducted on geographies consisting of 61,685,490 people shows a poor negative correlation between the proportion of Aleuts and percentage of population with at least professional degree education in the United States with a correlation coefficient (R) of -0.139 and weighted average of 3.6%, a difference of 8.1%.
Professional Degree Correlation Summary
| Measurement | Cree | Aleut |
| Minimum | 0.20% | 0.13% |
| Maximum | 6.3% | 12.2% |
| Range | 6.1% | 12.1% |
| Mean | 2.5% | 3.5% |
| Median | 2.1% | 2.6% |
| Interquartile 25% (IQ1) | 1.1% | 0.93% |
| Interquartile 75% (IQ3) | 3.8% | 4.6% |
| Interquartile Range (IQR) | 2.7% | 3.7% |
| Standard Deviation (Sample) | 1.7% | 3.2% |
| Standard Deviation (Population) | 1.7% | 3.1% |
Similar Demographics by Professional Degree
Demographics Similar to Cree by Professional Degree
In terms of professional degree, the demographic groups most similar to Cree are Ecuadorian (3.9%, a difference of 0.21%), Immigrants from Philippines (3.9%, a difference of 0.26%), Nonimmigrants (3.9%, a difference of 0.30%), Immigrants from Barbados (3.9%, a difference of 0.31%), and Spanish American (3.9%, a difference of 0.53%).
| Demographics | Rating | Rank | Professional Degree |
| Tlingit-Haida | 6.9 /100 | #225 | Tragic 4.0% |
| German Russians | 6.1 /100 | #226 | Tragic 4.0% |
| Cubans | 5.9 /100 | #227 | Tragic 4.0% |
| Immigrants | West Indies | 5.6 /100 | #228 | Tragic 4.0% |
| Immigrants | Burma/Myanmar | 5.4 /100 | #229 | Tragic 3.9% |
| Nicaraguans | 5.1 /100 | #230 | Tragic 3.9% |
| Ecuadorians | 4.6 /100 | #231 | Tragic 3.9% |
| Cree | 4.3 /100 | #232 | Tragic 3.9% |
| Immigrants | Philippines | 4.1 /100 | #233 | Tragic 3.9% |
| Immigrants | Nonimmigrants | 4.0 /100 | #234 | Tragic 3.9% |
| Immigrants | Barbados | 4.0 /100 | #235 | Tragic 3.9% |
| Spanish Americans | 3.8 /100 | #236 | Tragic 3.9% |
| Immigrants | Trinidad and Tobago | 3.8 /100 | #237 | Tragic 3.9% |
| Colville | 2.6 /100 | #238 | Tragic 3.8% |
| British West Indians | 2.4 /100 | #239 | Tragic 3.8% |
Demographics Similar to Aleuts by Professional Degree
In terms of professional degree, the demographic groups most similar to Aleuts are Delaware (3.6%, a difference of 0.15%), Central American Indian (3.6%, a difference of 0.42%), Immigrants from Cuba (3.6%, a difference of 0.60%), Immigrants from Congo (3.6%, a difference of 0.74%), and Immigrants from Cambodia (3.6%, a difference of 0.78%).
| Demographics | Rating | Rank | Professional Degree |
| Immigrants | Guyana | 1.0 /100 | #261 | Tragic 3.7% |
| U.S. Virgin Islanders | 1.0 /100 | #262 | Tragic 3.7% |
| Hopi | 0.9 /100 | #263 | Tragic 3.6% |
| Immigrants | Cambodia | 0.9 /100 | #264 | Tragic 3.6% |
| Immigrants | Congo | 0.8 /100 | #265 | Tragic 3.6% |
| Central American Indians | 0.8 /100 | #266 | Tragic 3.6% |
| Delaware | 0.7 /100 | #267 | Tragic 3.6% |
| Aleuts | 0.7 /100 | #268 | Tragic 3.6% |
| Immigrants | Cuba | 0.6 /100 | #269 | Tragic 3.6% |
| Central Americans | 0.6 /100 | #270 | Tragic 3.6% |
| Belizeans | 0.5 /100 | #271 | Tragic 3.6% |
| Immigrants | Jamaica | 0.5 /100 | #272 | Tragic 3.6% |
| Americans | 0.5 /100 | #273 | Tragic 3.6% |
| Potawatomi | 0.5 /100 | #274 | Tragic 3.6% |
| Immigrants | Dominica | 0.5 /100 | #275 | Tragic 3.6% |