Cree vs Immigrants from Guatemala Professional Degree
COMPARE
Cree
Immigrants from Guatemala
Professional Degree
Professional Degree Comparison
Cree
Immigrants from Guatemala
3.9%
PROFESSIONAL DEGREE
4.3/ 100
METRIC RATING
232nd/ 347
METRIC RANK
3.4%
PROFESSIONAL DEGREE
0.2/ 100
METRIC RATING
295th/ 347
METRIC RANK
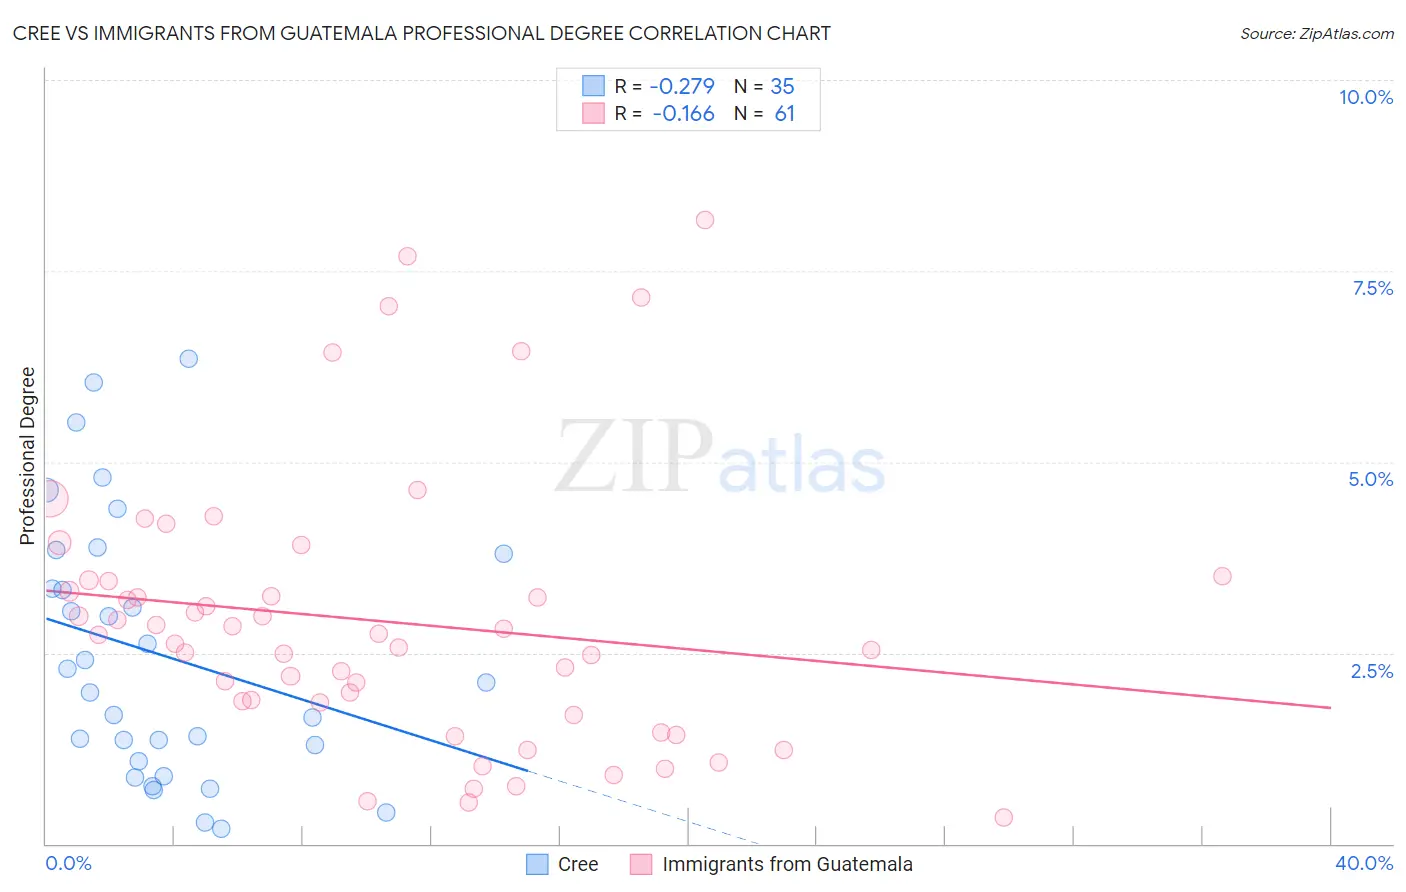
Cree vs Immigrants from Guatemala Professional Degree Correlation Chart
The statistical analysis conducted on geographies consisting of 76,148,984 people shows a weak negative correlation between the proportion of Cree and percentage of population with at least professional degree education in the United States with a correlation coefficient (R) of -0.279 and weighted average of 3.9%. Similarly, the statistical analysis conducted on geographies consisting of 376,144,765 people shows a poor negative correlation between the proportion of Immigrants from Guatemala and percentage of population with at least professional degree education in the United States with a correlation coefficient (R) of -0.166 and weighted average of 3.4%, a difference of 13.6%.
Professional Degree Correlation Summary
| Measurement | Cree | Immigrants from Guatemala |
| Minimum | 0.20% | 0.34% |
| Maximum | 6.3% | 8.2% |
| Range | 6.1% | 7.8% |
| Mean | 2.5% | 2.9% |
| Median | 2.1% | 2.7% |
| Interquartile 25% (IQ1) | 1.1% | 1.8% |
| Interquartile 75% (IQ3) | 3.8% | 3.4% |
| Interquartile Range (IQR) | 2.7% | 1.7% |
| Standard Deviation (Sample) | 1.7% | 1.8% |
| Standard Deviation (Population) | 1.7% | 1.8% |
Similar Demographics by Professional Degree
Demographics Similar to Cree by Professional Degree
In terms of professional degree, the demographic groups most similar to Cree are Ecuadorian (3.9%, a difference of 0.21%), Immigrants from Philippines (3.9%, a difference of 0.26%), Nonimmigrants (3.9%, a difference of 0.30%), Immigrants from Barbados (3.9%, a difference of 0.31%), and Spanish American (3.9%, a difference of 0.53%).
| Demographics | Rating | Rank | Professional Degree |
| Tlingit-Haida | 6.9 /100 | #225 | Tragic 4.0% |
| German Russians | 6.1 /100 | #226 | Tragic 4.0% |
| Cubans | 5.9 /100 | #227 | Tragic 4.0% |
| Immigrants | West Indies | 5.6 /100 | #228 | Tragic 4.0% |
| Immigrants | Burma/Myanmar | 5.4 /100 | #229 | Tragic 3.9% |
| Nicaraguans | 5.1 /100 | #230 | Tragic 3.9% |
| Ecuadorians | 4.6 /100 | #231 | Tragic 3.9% |
| Cree | 4.3 /100 | #232 | Tragic 3.9% |
| Immigrants | Philippines | 4.1 /100 | #233 | Tragic 3.9% |
| Immigrants | Nonimmigrants | 4.0 /100 | #234 | Tragic 3.9% |
| Immigrants | Barbados | 4.0 /100 | #235 | Tragic 3.9% |
| Spanish Americans | 3.8 /100 | #236 | Tragic 3.9% |
| Immigrants | Trinidad and Tobago | 3.8 /100 | #237 | Tragic 3.9% |
| Colville | 2.6 /100 | #238 | Tragic 3.8% |
| British West Indians | 2.4 /100 | #239 | Tragic 3.8% |
Demographics Similar to Immigrants from Guatemala by Professional Degree
In terms of professional degree, the demographic groups most similar to Immigrants from Guatemala are Hawaiian (3.4%, a difference of 0.010%), Paiute (3.4%, a difference of 0.16%), Immigrants from Honduras (3.5%, a difference of 0.24%), Immigrants from Liberia (3.4%, a difference of 0.35%), and Ottawa (3.4%, a difference of 0.40%).
| Demographics | Rating | Rank | Professional Degree |
| Blackfeet | 0.3 /100 | #288 | Tragic 3.5% |
| Guatemalans | 0.3 /100 | #289 | Tragic 3.5% |
| Chippewa | 0.3 /100 | #290 | Tragic 3.5% |
| Alaska Natives | 0.3 /100 | #291 | Tragic 3.5% |
| Immigrants | Belize | 0.3 /100 | #292 | Tragic 3.5% |
| Immigrants | Honduras | 0.3 /100 | #293 | Tragic 3.5% |
| Paiute | 0.3 /100 | #294 | Tragic 3.4% |
| Immigrants | Guatemala | 0.2 /100 | #295 | Tragic 3.4% |
| Hawaiians | 0.2 /100 | #296 | Tragic 3.4% |
| Immigrants | Liberia | 0.2 /100 | #297 | Tragic 3.4% |
| Ottawa | 0.2 /100 | #298 | Tragic 3.4% |
| Immigrants | Yemen | 0.2 /100 | #299 | Tragic 3.4% |
| Blacks/African Americans | 0.2 /100 | #300 | Tragic 3.4% |
| Immigrants | Dominican Republic | 0.2 /100 | #301 | Tragic 3.4% |
| Malaysians | 0.2 /100 | #302 | Tragic 3.4% |