South American vs Immigrants from Hungary Professional Degree
COMPARE
South American
Immigrants from Hungary
Professional Degree
Professional Degree Comparison
South Americans
Immigrants from Hungary
4.7%
PROFESSIONAL DEGREE
85.6/ 100
METRIC RATING
139th/ 347
METRIC RANK
5.5%
PROFESSIONAL DEGREE
99.9/ 100
METRIC RATING
69th/ 347
METRIC RANK
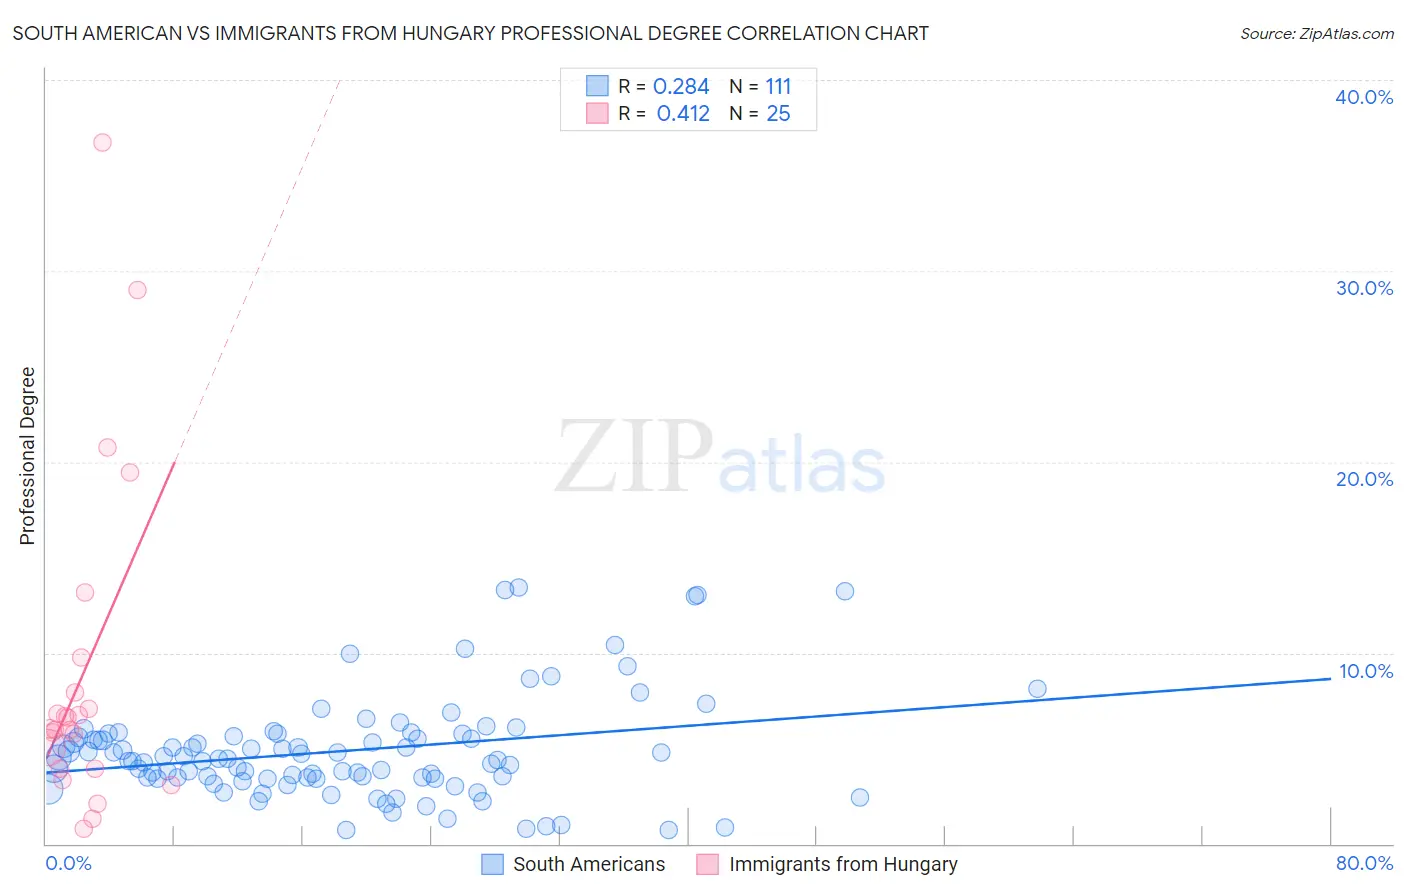
South American vs Immigrants from Hungary Professional Degree Correlation Chart
The statistical analysis conducted on geographies consisting of 492,254,354 people shows a weak positive correlation between the proportion of South Americans and percentage of population with at least professional degree education in the United States with a correlation coefficient (R) of 0.284 and weighted average of 4.7%. Similarly, the statistical analysis conducted on geographies consisting of 195,587,286 people shows a moderate positive correlation between the proportion of Immigrants from Hungary and percentage of population with at least professional degree education in the United States with a correlation coefficient (R) of 0.412 and weighted average of 5.5%, a difference of 16.3%.
Professional Degree Correlation Summary
| Measurement | South American | Immigrants from Hungary |
| Minimum | 0.74% | 0.81% |
| Maximum | 13.5% | 36.7% |
| Range | 12.7% | 35.9% |
| Mean | 4.9% | 8.9% |
| Median | 4.4% | 6.0% |
| Interquartile 25% (IQ1) | 3.4% | 3.9% |
| Interquartile 75% (IQ3) | 5.6% | 8.8% |
| Interquartile Range (IQR) | 2.2% | 4.9% |
| Standard Deviation (Sample) | 2.7% | 8.7% |
| Standard Deviation (Population) | 2.7% | 8.5% |
Similar Demographics by Professional Degree
Demographics Similar to South Americans by Professional Degree
In terms of professional degree, the demographic groups most similar to South Americans are Canadian (4.7%, a difference of 0.34%), Basque (4.6%, a difference of 0.96%), Afghan (4.7%, a difference of 0.99%), Jordanian (4.7%, a difference of 1.0%), and Immigrants from Jordan (4.7%, a difference of 1.1%).
| Demographics | Rating | Rank | Professional Degree |
| Pakistanis | 90.9 /100 | #132 | Exceptional 4.8% |
| Italians | 90.2 /100 | #133 | Exceptional 4.8% |
| South American Indians | 89.9 /100 | #134 | Excellent 4.8% |
| Macedonians | 89.8 /100 | #135 | Excellent 4.8% |
| Immigrants | Jordan | 89.0 /100 | #136 | Excellent 4.7% |
| Jordanians | 88.9 /100 | #137 | Excellent 4.7% |
| Afghans | 88.8 /100 | #138 | Excellent 4.7% |
| South Americans | 85.6 /100 | #139 | Excellent 4.7% |
| Canadians | 84.4 /100 | #140 | Excellent 4.7% |
| Basques | 81.8 /100 | #141 | Excellent 4.6% |
| Sudanese | 81.3 /100 | #142 | Excellent 4.6% |
| Hungarians | 80.8 /100 | #143 | Excellent 4.6% |
| Immigrants | South America | 80.5 /100 | #144 | Excellent 4.6% |
| Uruguayans | 80.2 /100 | #145 | Excellent 4.6% |
| Luxembourgers | 78.7 /100 | #146 | Good 4.6% |
Demographics Similar to Immigrants from Hungary by Professional Degree
In terms of professional degree, the demographic groups most similar to Immigrants from Hungary are Immigrants from Lebanon (5.5%, a difference of 0.080%), Immigrants from Bulgaria (5.5%, a difference of 0.26%), Bhutanese (5.4%, a difference of 0.33%), Immigrants from Kazakhstan (5.5%, a difference of 0.59%), and Immigrants from Bolivia (5.5%, a difference of 0.83%).
| Demographics | Rating | Rank | Professional Degree |
| Immigrants | Belarus | 99.9 /100 | #62 | Exceptional 5.5% |
| Asians | 99.9 /100 | #63 | Exceptional 5.5% |
| Immigrants | Asia | 99.9 /100 | #64 | Exceptional 5.5% |
| Immigrants | Bolivia | 99.9 /100 | #65 | Exceptional 5.5% |
| Immigrants | Kazakhstan | 99.9 /100 | #66 | Exceptional 5.5% |
| Immigrants | Bulgaria | 99.9 /100 | #67 | Exceptional 5.5% |
| Immigrants | Lebanon | 99.9 /100 | #68 | Exceptional 5.5% |
| Immigrants | Hungary | 99.9 /100 | #69 | Exceptional 5.5% |
| Bhutanese | 99.8 /100 | #70 | Exceptional 5.4% |
| Immigrants | Western Asia | 99.8 /100 | #71 | Exceptional 5.4% |
| Lithuanians | 99.8 /100 | #72 | Exceptional 5.4% |
| Immigrants | Romania | 99.8 /100 | #73 | Exceptional 5.4% |
| Ethiopians | 99.7 /100 | #74 | Exceptional 5.4% |
| Immigrants | Indonesia | 99.7 /100 | #75 | Exceptional 5.3% |
| Immigrants | Canada | 99.7 /100 | #76 | Exceptional 5.3% |