Cree vs Immigrants from Colombia Professional Degree
COMPARE
Cree
Immigrants from Colombia
Professional Degree
Professional Degree Comparison
Cree
Immigrants from Colombia
3.9%
PROFESSIONAL DEGREE
4.3/ 100
METRIC RATING
232nd/ 347
METRIC RANK
4.5%
PROFESSIONAL DEGREE
59.4/ 100
METRIC RATING
166th/ 347
METRIC RANK
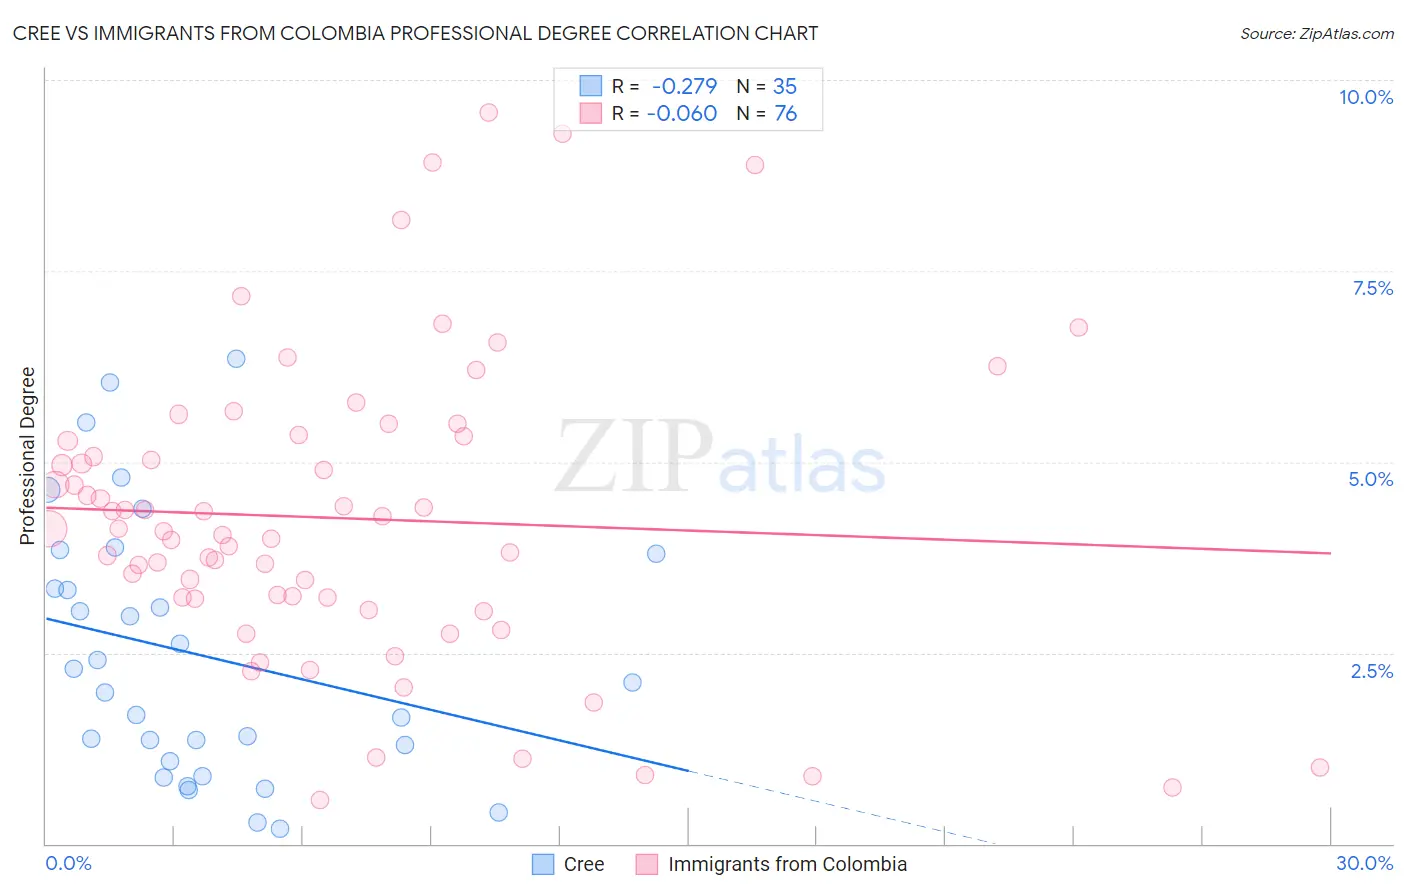
Cree vs Immigrants from Colombia Professional Degree Correlation Chart
The statistical analysis conducted on geographies consisting of 76,148,984 people shows a weak negative correlation between the proportion of Cree and percentage of population with at least professional degree education in the United States with a correlation coefficient (R) of -0.279 and weighted average of 3.9%. Similarly, the statistical analysis conducted on geographies consisting of 378,013,627 people shows a slight negative correlation between the proportion of Immigrants from Colombia and percentage of population with at least professional degree education in the United States with a correlation coefficient (R) of -0.060 and weighted average of 4.5%, a difference of 14.2%.
Professional Degree Correlation Summary
| Measurement | Cree | Immigrants from Colombia |
| Minimum | 0.20% | 0.57% |
| Maximum | 6.3% | 9.6% |
| Range | 6.1% | 9.0% |
| Mean | 2.5% | 4.3% |
| Median | 2.1% | 4.1% |
| Interquartile 25% (IQ1) | 1.1% | 3.2% |
| Interquartile 75% (IQ3) | 3.8% | 5.3% |
| Interquartile Range (IQR) | 2.7% | 2.1% |
| Standard Deviation (Sample) | 1.7% | 2.0% |
| Standard Deviation (Population) | 1.7% | 2.0% |
Similar Demographics by Professional Degree
Demographics Similar to Cree by Professional Degree
In terms of professional degree, the demographic groups most similar to Cree are Ecuadorian (3.9%, a difference of 0.21%), Immigrants from Philippines (3.9%, a difference of 0.26%), Nonimmigrants (3.9%, a difference of 0.30%), Immigrants from Barbados (3.9%, a difference of 0.31%), and Spanish American (3.9%, a difference of 0.53%).
| Demographics | Rating | Rank | Professional Degree |
| Tlingit-Haida | 6.9 /100 | #225 | Tragic 4.0% |
| German Russians | 6.1 /100 | #226 | Tragic 4.0% |
| Cubans | 5.9 /100 | #227 | Tragic 4.0% |
| Immigrants | West Indies | 5.6 /100 | #228 | Tragic 4.0% |
| Immigrants | Burma/Myanmar | 5.4 /100 | #229 | Tragic 3.9% |
| Nicaraguans | 5.1 /100 | #230 | Tragic 3.9% |
| Ecuadorians | 4.6 /100 | #231 | Tragic 3.9% |
| Cree | 4.3 /100 | #232 | Tragic 3.9% |
| Immigrants | Philippines | 4.1 /100 | #233 | Tragic 3.9% |
| Immigrants | Nonimmigrants | 4.0 /100 | #234 | Tragic 3.9% |
| Immigrants | Barbados | 4.0 /100 | #235 | Tragic 3.9% |
| Spanish Americans | 3.8 /100 | #236 | Tragic 3.9% |
| Immigrants | Trinidad and Tobago | 3.8 /100 | #237 | Tragic 3.9% |
| Colville | 2.6 /100 | #238 | Tragic 3.8% |
| British West Indians | 2.4 /100 | #239 | Tragic 3.8% |
Demographics Similar to Immigrants from Colombia by Professional Degree
In terms of professional degree, the demographic groups most similar to Immigrants from Colombia are Immigrants from Afghanistan (4.5%, a difference of 0.030%), Costa Rican (4.5%, a difference of 0.080%), Immigrants from Sierra Leone (4.5%, a difference of 0.10%), Chinese (4.5%, a difference of 0.11%), and Swiss (4.5%, a difference of 0.24%).
| Demographics | Rating | Rank | Professional Degree |
| Vietnamese | 68.4 /100 | #159 | Good 4.5% |
| Immigrants | Senegal | 68.0 /100 | #160 | Good 4.5% |
| Assyrians/Chaldeans/Syriacs | 67.4 /100 | #161 | Good 4.5% |
| Peruvians | 65.2 /100 | #162 | Good 4.5% |
| Sierra Leoneans | 64.3 /100 | #163 | Good 4.5% |
| Swiss | 61.0 /100 | #164 | Good 4.5% |
| Costa Ricans | 59.9 /100 | #165 | Average 4.5% |
| Immigrants | Colombia | 59.4 /100 | #166 | Average 4.5% |
| Immigrants | Afghanistan | 59.2 /100 | #167 | Average 4.5% |
| Immigrants | Sierra Leone | 58.7 /100 | #168 | Average 4.5% |
| Chinese | 58.6 /100 | #169 | Average 4.5% |
| Immigrants | Zaire | 57.4 /100 | #170 | Average 4.5% |
| Immigrants | Bangladesh | 56.0 /100 | #171 | Average 4.4% |
| Spaniards | 52.0 /100 | #172 | Average 4.4% |
| English | 50.1 /100 | #173 | Average 4.4% |