Ghanaian vs Immigrants from Hungary Professional Degree
COMPARE
Ghanaian
Immigrants from Hungary
Professional Degree
Professional Degree Comparison
Ghanaians
Immigrants from Hungary
4.3%
PROFESSIONAL DEGREE
27.3/ 100
METRIC RATING
192nd/ 347
METRIC RANK
5.5%
PROFESSIONAL DEGREE
99.9/ 100
METRIC RATING
69th/ 347
METRIC RANK
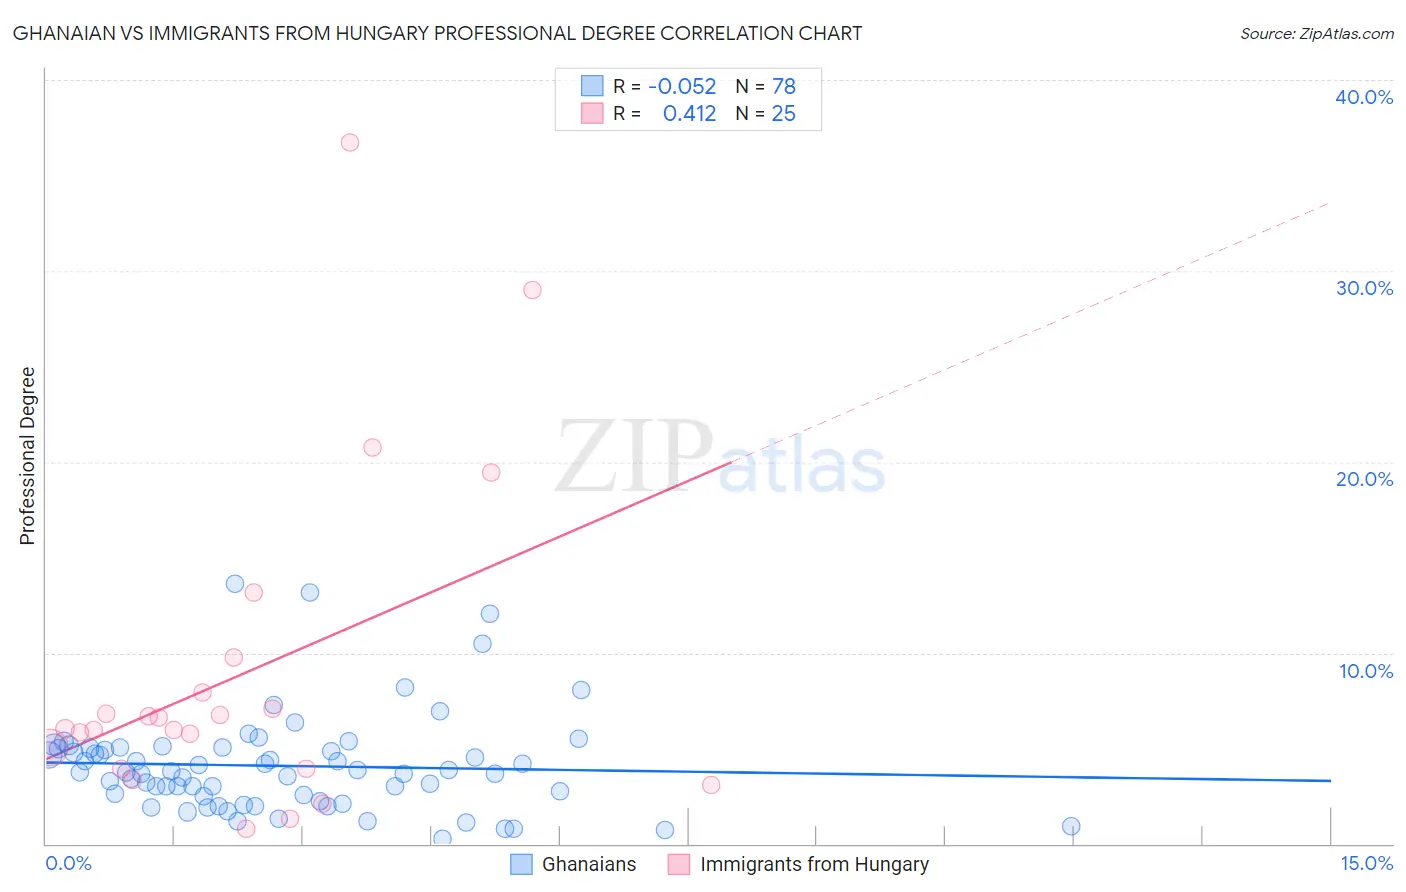
Ghanaian vs Immigrants from Hungary Professional Degree Correlation Chart
The statistical analysis conducted on geographies consisting of 190,481,529 people shows a slight negative correlation between the proportion of Ghanaians and percentage of population with at least professional degree education in the United States with a correlation coefficient (R) of -0.052 and weighted average of 4.3%. Similarly, the statistical analysis conducted on geographies consisting of 195,587,286 people shows a moderate positive correlation between the proportion of Immigrants from Hungary and percentage of population with at least professional degree education in the United States with a correlation coefficient (R) of 0.412 and weighted average of 5.5%, a difference of 28.4%.
Professional Degree Correlation Summary
| Measurement | Ghanaian | Immigrants from Hungary |
| Minimum | 0.25% | 0.81% |
| Maximum | 13.6% | 36.7% |
| Range | 13.4% | 35.9% |
| Mean | 4.1% | 8.9% |
| Median | 3.7% | 6.0% |
| Interquartile 25% (IQ1) | 2.5% | 3.9% |
| Interquartile 75% (IQ3) | 5.0% | 8.8% |
| Interquartile Range (IQR) | 2.5% | 4.9% |
| Standard Deviation (Sample) | 2.6% | 8.7% |
| Standard Deviation (Population) | 2.6% | 8.5% |
Similar Demographics by Professional Degree
Demographics Similar to Ghanaians by Professional Degree
In terms of professional degree, the demographic groups most similar to Ghanaians are French (4.2%, a difference of 0.040%), Scandinavian (4.2%, a difference of 0.29%), Sri Lankan (4.3%, a difference of 0.32%), Immigrants from Poland (4.3%, a difference of 0.36%), and Nigerian (4.2%, a difference of 0.53%).
| Demographics | Rating | Rank | Professional Degree |
| Welsh | 35.8 /100 | #185 | Fair 4.3% |
| Scotch-Irish | 34.2 /100 | #186 | Fair 4.3% |
| Immigrants | Cameroon | 33.3 /100 | #187 | Fair 4.3% |
| Immigrants | Thailand | 31.7 /100 | #188 | Fair 4.3% |
| Slovaks | 30.7 /100 | #189 | Fair 4.3% |
| Immigrants | Poland | 29.2 /100 | #190 | Fair 4.3% |
| Sri Lankans | 29.0 /100 | #191 | Fair 4.3% |
| Ghanaians | 27.3 /100 | #192 | Fair 4.3% |
| French | 27.1 /100 | #193 | Fair 4.2% |
| Scandinavians | 25.8 /100 | #194 | Fair 4.2% |
| Nigerians | 24.6 /100 | #195 | Fair 4.2% |
| Spanish | 23.0 /100 | #196 | Fair 4.2% |
| Czechoslovakians | 22.4 /100 | #197 | Fair 4.2% |
| Immigrants | Middle Africa | 22.1 /100 | #198 | Fair 4.2% |
| Norwegians | 20.5 /100 | #199 | Fair 4.2% |
Demographics Similar to Immigrants from Hungary by Professional Degree
In terms of professional degree, the demographic groups most similar to Immigrants from Hungary are Immigrants from Lebanon (5.5%, a difference of 0.080%), Immigrants from Bulgaria (5.5%, a difference of 0.26%), Bhutanese (5.4%, a difference of 0.33%), Immigrants from Kazakhstan (5.5%, a difference of 0.59%), and Immigrants from Bolivia (5.5%, a difference of 0.83%).
| Demographics | Rating | Rank | Professional Degree |
| Immigrants | Belarus | 99.9 /100 | #62 | Exceptional 5.5% |
| Asians | 99.9 /100 | #63 | Exceptional 5.5% |
| Immigrants | Asia | 99.9 /100 | #64 | Exceptional 5.5% |
| Immigrants | Bolivia | 99.9 /100 | #65 | Exceptional 5.5% |
| Immigrants | Kazakhstan | 99.9 /100 | #66 | Exceptional 5.5% |
| Immigrants | Bulgaria | 99.9 /100 | #67 | Exceptional 5.5% |
| Immigrants | Lebanon | 99.9 /100 | #68 | Exceptional 5.5% |
| Immigrants | Hungary | 99.9 /100 | #69 | Exceptional 5.5% |
| Bhutanese | 99.8 /100 | #70 | Exceptional 5.4% |
| Immigrants | Western Asia | 99.8 /100 | #71 | Exceptional 5.4% |
| Lithuanians | 99.8 /100 | #72 | Exceptional 5.4% |
| Immigrants | Romania | 99.8 /100 | #73 | Exceptional 5.4% |
| Ethiopians | 99.7 /100 | #74 | Exceptional 5.4% |
| Immigrants | Indonesia | 99.7 /100 | #75 | Exceptional 5.3% |
| Immigrants | Canada | 99.7 /100 | #76 | Exceptional 5.3% |