Cree vs Immigrants from Egypt Professional Degree
COMPARE
Cree
Immigrants from Egypt
Professional Degree
Professional Degree Comparison
Cree
Immigrants from Egypt
3.9%
PROFESSIONAL DEGREE
4.3/ 100
METRIC RATING
232nd/ 347
METRIC RANK
5.1%
PROFESSIONAL DEGREE
98.5/ 100
METRIC RATING
101st/ 347
METRIC RANK
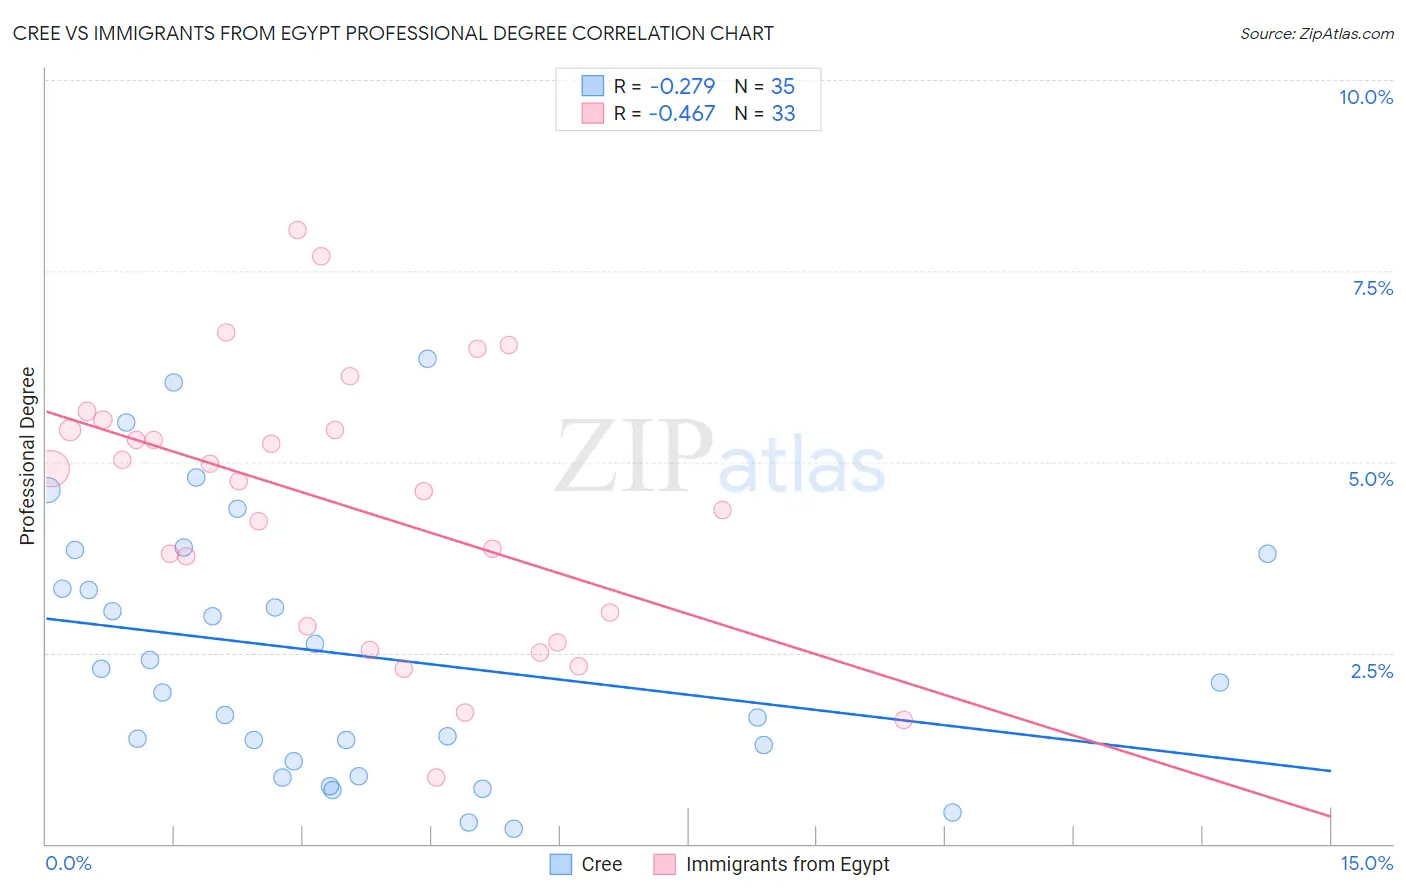
Cree vs Immigrants from Egypt Professional Degree Correlation Chart
The statistical analysis conducted on geographies consisting of 76,148,984 people shows a weak negative correlation between the proportion of Cree and percentage of population with at least professional degree education in the United States with a correlation coefficient (R) of -0.279 and weighted average of 3.9%. Similarly, the statistical analysis conducted on geographies consisting of 245,381,145 people shows a moderate negative correlation between the proportion of Immigrants from Egypt and percentage of population with at least professional degree education in the United States with a correlation coefficient (R) of -0.467 and weighted average of 5.1%, a difference of 29.8%.
Professional Degree Correlation Summary
| Measurement | Cree | Immigrants from Egypt |
| Minimum | 0.20% | 0.86% |
| Maximum | 6.3% | 8.0% |
| Range | 6.1% | 7.2% |
| Mean | 2.5% | 4.4% |
| Median | 2.1% | 4.7% |
| Interquartile 25% (IQ1) | 1.1% | 2.7% |
| Interquartile 75% (IQ3) | 3.8% | 5.5% |
| Interquartile Range (IQR) | 2.7% | 2.7% |
| Standard Deviation (Sample) | 1.7% | 1.8% |
| Standard Deviation (Population) | 1.7% | 1.8% |
Similar Demographics by Professional Degree
Demographics Similar to Cree by Professional Degree
In terms of professional degree, the demographic groups most similar to Cree are Ecuadorian (3.9%, a difference of 0.21%), Immigrants from Philippines (3.9%, a difference of 0.26%), Nonimmigrants (3.9%, a difference of 0.30%), Immigrants from Barbados (3.9%, a difference of 0.31%), and Spanish American (3.9%, a difference of 0.53%).
| Demographics | Rating | Rank | Professional Degree |
| Tlingit-Haida | 6.9 /100 | #225 | Tragic 4.0% |
| German Russians | 6.1 /100 | #226 | Tragic 4.0% |
| Cubans | 5.9 /100 | #227 | Tragic 4.0% |
| Immigrants | West Indies | 5.6 /100 | #228 | Tragic 4.0% |
| Immigrants | Burma/Myanmar | 5.4 /100 | #229 | Tragic 3.9% |
| Nicaraguans | 5.1 /100 | #230 | Tragic 3.9% |
| Ecuadorians | 4.6 /100 | #231 | Tragic 3.9% |
| Cree | 4.3 /100 | #232 | Tragic 3.9% |
| Immigrants | Philippines | 4.1 /100 | #233 | Tragic 3.9% |
| Immigrants | Nonimmigrants | 4.0 /100 | #234 | Tragic 3.9% |
| Immigrants | Barbados | 4.0 /100 | #235 | Tragic 3.9% |
| Spanish Americans | 3.8 /100 | #236 | Tragic 3.9% |
| Immigrants | Trinidad and Tobago | 3.8 /100 | #237 | Tragic 3.9% |
| Colville | 2.6 /100 | #238 | Tragic 3.8% |
| British West Indians | 2.4 /100 | #239 | Tragic 3.8% |
Demographics Similar to Immigrants from Egypt by Professional Degree
In terms of professional degree, the demographic groups most similar to Immigrants from Egypt are Ukrainian (5.1%, a difference of 0.080%), Immigrants from Northern Africa (5.1%, a difference of 0.33%), Arab (5.0%, a difference of 0.64%), Immigrants from Uganda (5.0%, a difference of 0.67%), and Immigrants from Ukraine (5.0%, a difference of 0.69%).
| Demographics | Rating | Rank | Professional Degree |
| Alsatians | 99.3 /100 | #94 | Exceptional 5.2% |
| Zimbabweans | 99.3 /100 | #95 | Exceptional 5.2% |
| Immigrants | Uzbekistan | 99.2 /100 | #96 | Exceptional 5.2% |
| Syrians | 99.1 /100 | #97 | Exceptional 5.2% |
| Austrians | 99.1 /100 | #98 | Exceptional 5.2% |
| Immigrants | Italy | 99.1 /100 | #99 | Exceptional 5.2% |
| Ugandans | 98.8 /100 | #100 | Exceptional 5.1% |
| Immigrants | Egypt | 98.5 /100 | #101 | Exceptional 5.1% |
| Ukrainians | 98.5 /100 | #102 | Exceptional 5.1% |
| Immigrants | Northern Africa | 98.4 /100 | #103 | Exceptional 5.1% |
| Arabs | 98.2 /100 | #104 | Exceptional 5.0% |
| Immigrants | Uganda | 98.2 /100 | #105 | Exceptional 5.0% |
| Immigrants | Ukraine | 98.2 /100 | #106 | Exceptional 5.0% |
| Maltese | 98.1 /100 | #107 | Exceptional 5.0% |
| Immigrants | Southern Europe | 98.1 /100 | #108 | Exceptional 5.0% |