Cree vs Immigrants from Eritrea Professional Degree
COMPARE
Cree
Immigrants from Eritrea
Professional Degree
Professional Degree Comparison
Cree
Immigrants from Eritrea
3.9%
PROFESSIONAL DEGREE
4.3/ 100
METRIC RATING
232nd/ 347
METRIC RANK
4.8%
PROFESSIONAL DEGREE
93.5/ 100
METRIC RATING
124th/ 347
METRIC RANK
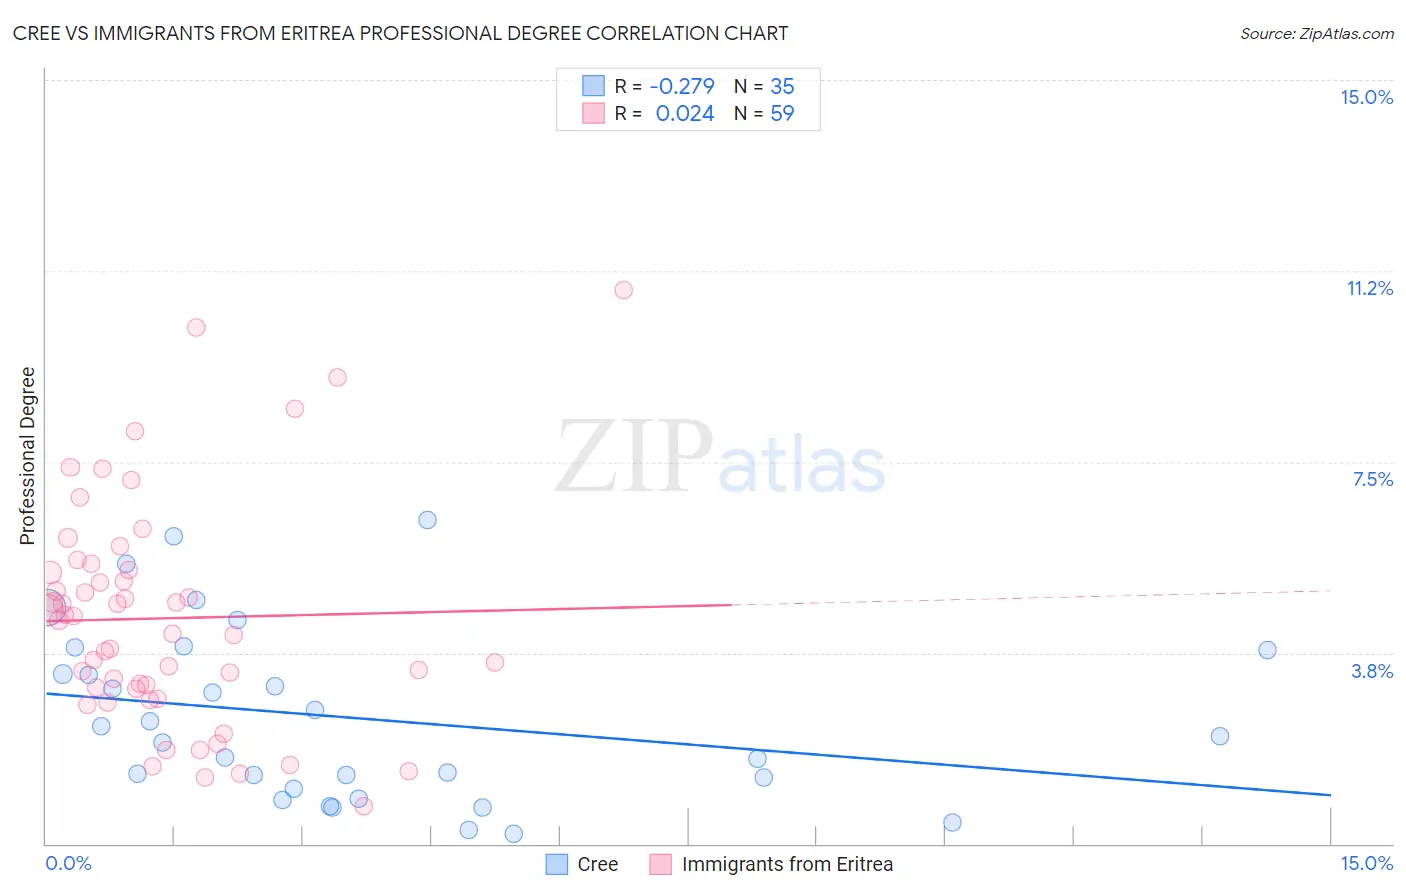
Cree vs Immigrants from Eritrea Professional Degree Correlation Chart
The statistical analysis conducted on geographies consisting of 76,148,984 people shows a weak negative correlation between the proportion of Cree and percentage of population with at least professional degree education in the United States with a correlation coefficient (R) of -0.279 and weighted average of 3.9%. Similarly, the statistical analysis conducted on geographies consisting of 104,813,744 people shows no correlation between the proportion of Immigrants from Eritrea and percentage of population with at least professional degree education in the United States with a correlation coefficient (R) of 0.024 and weighted average of 4.8%, a difference of 23.6%.
Professional Degree Correlation Summary
| Measurement | Cree | Immigrants from Eritrea |
| Minimum | 0.20% | 0.74% |
| Maximum | 6.3% | 10.9% |
| Range | 6.1% | 10.1% |
| Mean | 2.5% | 4.4% |
| Median | 2.1% | 4.4% |
| Interquartile 25% (IQ1) | 1.1% | 3.1% |
| Interquartile 75% (IQ3) | 3.8% | 5.4% |
| Interquartile Range (IQR) | 2.7% | 2.3% |
| Standard Deviation (Sample) | 1.7% | 2.2% |
| Standard Deviation (Population) | 1.7% | 2.2% |
Similar Demographics by Professional Degree
Demographics Similar to Cree by Professional Degree
In terms of professional degree, the demographic groups most similar to Cree are Ecuadorian (3.9%, a difference of 0.21%), Immigrants from Philippines (3.9%, a difference of 0.26%), Nonimmigrants (3.9%, a difference of 0.30%), Immigrants from Barbados (3.9%, a difference of 0.31%), and Spanish American (3.9%, a difference of 0.53%).
| Demographics | Rating | Rank | Professional Degree |
| Tlingit-Haida | 6.9 /100 | #225 | Tragic 4.0% |
| German Russians | 6.1 /100 | #226 | Tragic 4.0% |
| Cubans | 5.9 /100 | #227 | Tragic 4.0% |
| Immigrants | West Indies | 5.6 /100 | #228 | Tragic 4.0% |
| Immigrants | Burma/Myanmar | 5.4 /100 | #229 | Tragic 3.9% |
| Nicaraguans | 5.1 /100 | #230 | Tragic 3.9% |
| Ecuadorians | 4.6 /100 | #231 | Tragic 3.9% |
| Cree | 4.3 /100 | #232 | Tragic 3.9% |
| Immigrants | Philippines | 4.1 /100 | #233 | Tragic 3.9% |
| Immigrants | Nonimmigrants | 4.0 /100 | #234 | Tragic 3.9% |
| Immigrants | Barbados | 4.0 /100 | #235 | Tragic 3.9% |
| Spanish Americans | 3.8 /100 | #236 | Tragic 3.9% |
| Immigrants | Trinidad and Tobago | 3.8 /100 | #237 | Tragic 3.9% |
| Colville | 2.6 /100 | #238 | Tragic 3.8% |
| British West Indians | 2.4 /100 | #239 | Tragic 3.8% |
Demographics Similar to Immigrants from Eritrea by Professional Degree
In terms of professional degree, the demographic groups most similar to Immigrants from Eritrea are Immigrants from Albania (4.8%, a difference of 0.12%), European (4.8%, a difference of 0.17%), Immigrants from Venezuela (4.8%, a difference of 0.18%), Immigrants from Germany (4.9%, a difference of 0.35%), and Serbian (4.8%, a difference of 0.47%).
| Demographics | Rating | Rank | Professional Degree |
| Immigrants | Syria | 96.0 /100 | #117 | Exceptional 4.9% |
| Croatians | 96.0 /100 | #118 | Exceptional 4.9% |
| Immigrants | Sudan | 95.4 /100 | #119 | Exceptional 4.9% |
| Albanians | 95.3 /100 | #120 | Exceptional 4.9% |
| Immigrants | Moldova | 94.8 /100 | #121 | Exceptional 4.9% |
| Immigrants | Germany | 94.1 /100 | #122 | Exceptional 4.9% |
| Immigrants | Venezuela | 93.8 /100 | #123 | Exceptional 4.8% |
| Immigrants | Eritrea | 93.5 /100 | #124 | Exceptional 4.8% |
| Immigrants | Albania | 93.3 /100 | #125 | Exceptional 4.8% |
| Europeans | 93.2 /100 | #126 | Exceptional 4.8% |
| Serbians | 92.6 /100 | #127 | Exceptional 4.8% |
| Immigrants | Eastern Africa | 92.5 /100 | #128 | Exceptional 4.8% |
| Palestinians | 91.5 /100 | #129 | Exceptional 4.8% |
| Icelanders | 91.5 /100 | #130 | Exceptional 4.8% |
| Immigrants | Nepal | 91.4 /100 | #131 | Exceptional 4.8% |