Kenyan vs Immigrants from Hungary Professional Degree
COMPARE
Kenyan
Immigrants from Hungary
Professional Degree
Professional Degree Comparison
Kenyans
Immigrants from Hungary
4.4%
PROFESSIONAL DEGREE
50.0/ 100
METRIC RATING
174th/ 347
METRIC RANK
5.5%
PROFESSIONAL DEGREE
99.9/ 100
METRIC RATING
69th/ 347
METRIC RANK
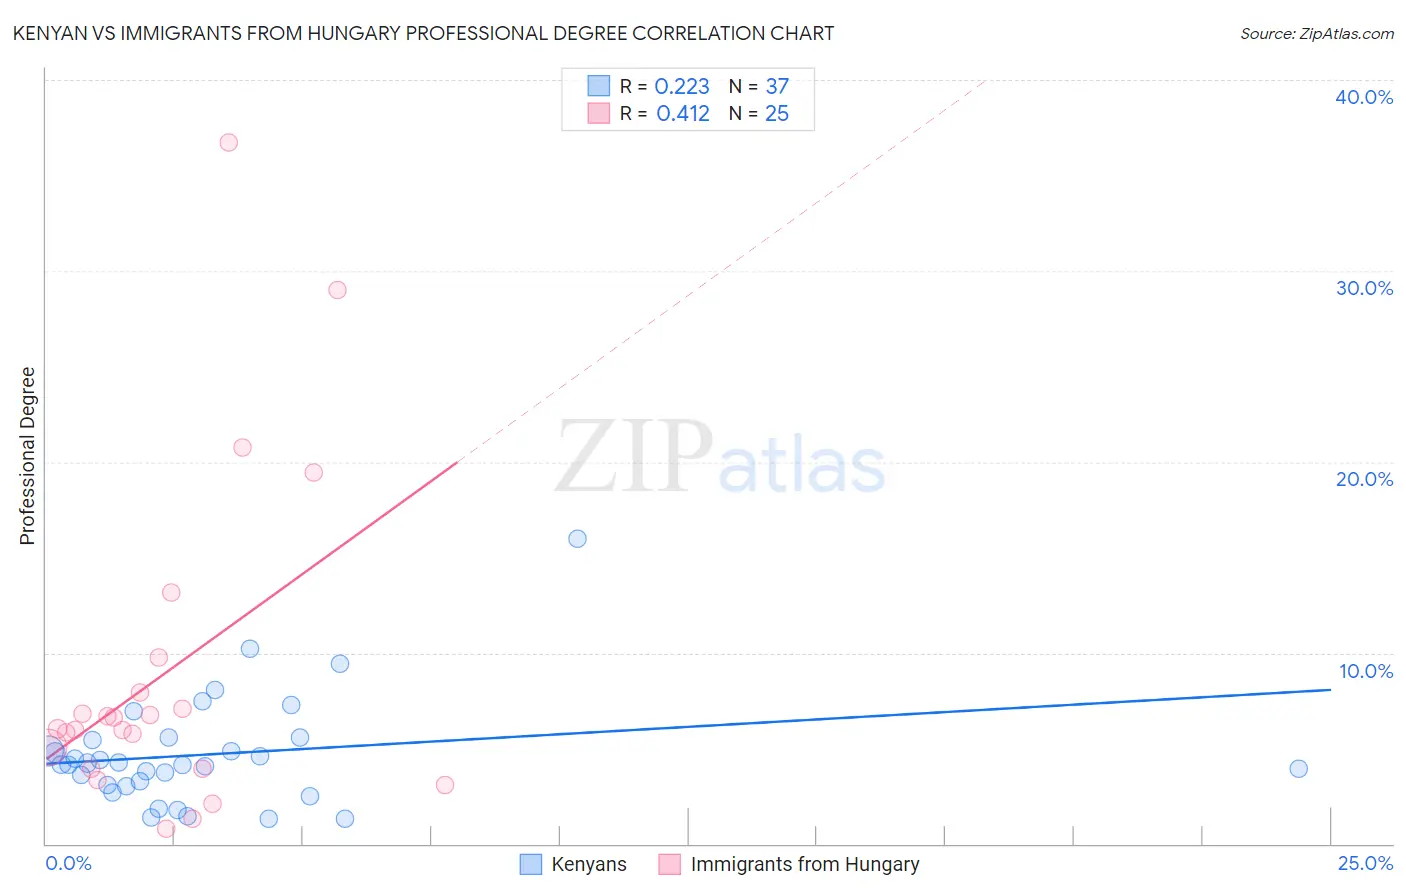
Kenyan vs Immigrants from Hungary Professional Degree Correlation Chart
The statistical analysis conducted on geographies consisting of 168,089,773 people shows a weak positive correlation between the proportion of Kenyans and percentage of population with at least professional degree education in the United States with a correlation coefficient (R) of 0.223 and weighted average of 4.4%. Similarly, the statistical analysis conducted on geographies consisting of 195,587,286 people shows a moderate positive correlation between the proportion of Immigrants from Hungary and percentage of population with at least professional degree education in the United States with a correlation coefficient (R) of 0.412 and weighted average of 5.5%, a difference of 23.8%.
Professional Degree Correlation Summary
| Measurement | Kenyan | Immigrants from Hungary |
| Minimum | 1.3% | 0.81% |
| Maximum | 16.0% | 36.7% |
| Range | 14.7% | 35.9% |
| Mean | 4.7% | 8.9% |
| Median | 4.2% | 6.0% |
| Interquartile 25% (IQ1) | 3.0% | 3.9% |
| Interquartile 75% (IQ3) | 5.5% | 8.8% |
| Interquartile Range (IQR) | 2.5% | 4.9% |
| Standard Deviation (Sample) | 2.9% | 8.7% |
| Standard Deviation (Population) | 2.8% | 8.5% |
Similar Demographics by Professional Degree
Demographics Similar to Kenyans by Professional Degree
In terms of professional degree, the demographic groups most similar to Kenyans are Irish (4.4%, a difference of 0.0%), English (4.4%, a difference of 0.010%), Immigrants from Peru (4.4%, a difference of 0.10%), Spaniard (4.4%, a difference of 0.29%), and Celtic (4.4%, a difference of 0.35%).
| Demographics | Rating | Rank | Professional Degree |
| Immigrants | Afghanistan | 59.2 /100 | #167 | Average 4.5% |
| Immigrants | Sierra Leone | 58.7 /100 | #168 | Average 4.5% |
| Chinese | 58.6 /100 | #169 | Average 4.5% |
| Immigrants | Zaire | 57.4 /100 | #170 | Average 4.5% |
| Immigrants | Bangladesh | 56.0 /100 | #171 | Average 4.4% |
| Spaniards | 52.0 /100 | #172 | Average 4.4% |
| English | 50.1 /100 | #173 | Average 4.4% |
| Kenyans | 50.0 /100 | #174 | Average 4.4% |
| Irish | 50.0 /100 | #175 | Average 4.4% |
| Immigrants | Peru | 49.3 /100 | #176 | Average 4.4% |
| Celtics | 47.6 /100 | #177 | Average 4.4% |
| Immigrants | Costa Rica | 46.7 /100 | #178 | Average 4.4% |
| Immigrants | Kenya | 45.9 /100 | #179 | Average 4.4% |
| Czechs | 44.9 /100 | #180 | Average 4.4% |
| Danes | 43.5 /100 | #181 | Average 4.4% |
Demographics Similar to Immigrants from Hungary by Professional Degree
In terms of professional degree, the demographic groups most similar to Immigrants from Hungary are Immigrants from Lebanon (5.5%, a difference of 0.080%), Immigrants from Bulgaria (5.5%, a difference of 0.26%), Bhutanese (5.4%, a difference of 0.33%), Immigrants from Kazakhstan (5.5%, a difference of 0.59%), and Immigrants from Bolivia (5.5%, a difference of 0.83%).
| Demographics | Rating | Rank | Professional Degree |
| Immigrants | Belarus | 99.9 /100 | #62 | Exceptional 5.5% |
| Asians | 99.9 /100 | #63 | Exceptional 5.5% |
| Immigrants | Asia | 99.9 /100 | #64 | Exceptional 5.5% |
| Immigrants | Bolivia | 99.9 /100 | #65 | Exceptional 5.5% |
| Immigrants | Kazakhstan | 99.9 /100 | #66 | Exceptional 5.5% |
| Immigrants | Bulgaria | 99.9 /100 | #67 | Exceptional 5.5% |
| Immigrants | Lebanon | 99.9 /100 | #68 | Exceptional 5.5% |
| Immigrants | Hungary | 99.9 /100 | #69 | Exceptional 5.5% |
| Bhutanese | 99.8 /100 | #70 | Exceptional 5.4% |
| Immigrants | Western Asia | 99.8 /100 | #71 | Exceptional 5.4% |
| Lithuanians | 99.8 /100 | #72 | Exceptional 5.4% |
| Immigrants | Romania | 99.8 /100 | #73 | Exceptional 5.4% |
| Ethiopians | 99.7 /100 | #74 | Exceptional 5.4% |
| Immigrants | Indonesia | 99.7 /100 | #75 | Exceptional 5.3% |
| Immigrants | Canada | 99.7 /100 | #76 | Exceptional 5.3% |