Cree vs Inupiat Professional Degree
COMPARE
Cree
Inupiat
Professional Degree
Professional Degree Comparison
Cree
Inupiat
3.9%
PROFESSIONAL DEGREE
4.3/ 100
METRIC RATING
232nd/ 347
METRIC RANK
3.2%
PROFESSIONAL DEGREE
0.0/ 100
METRIC RATING
323rd/ 347
METRIC RANK
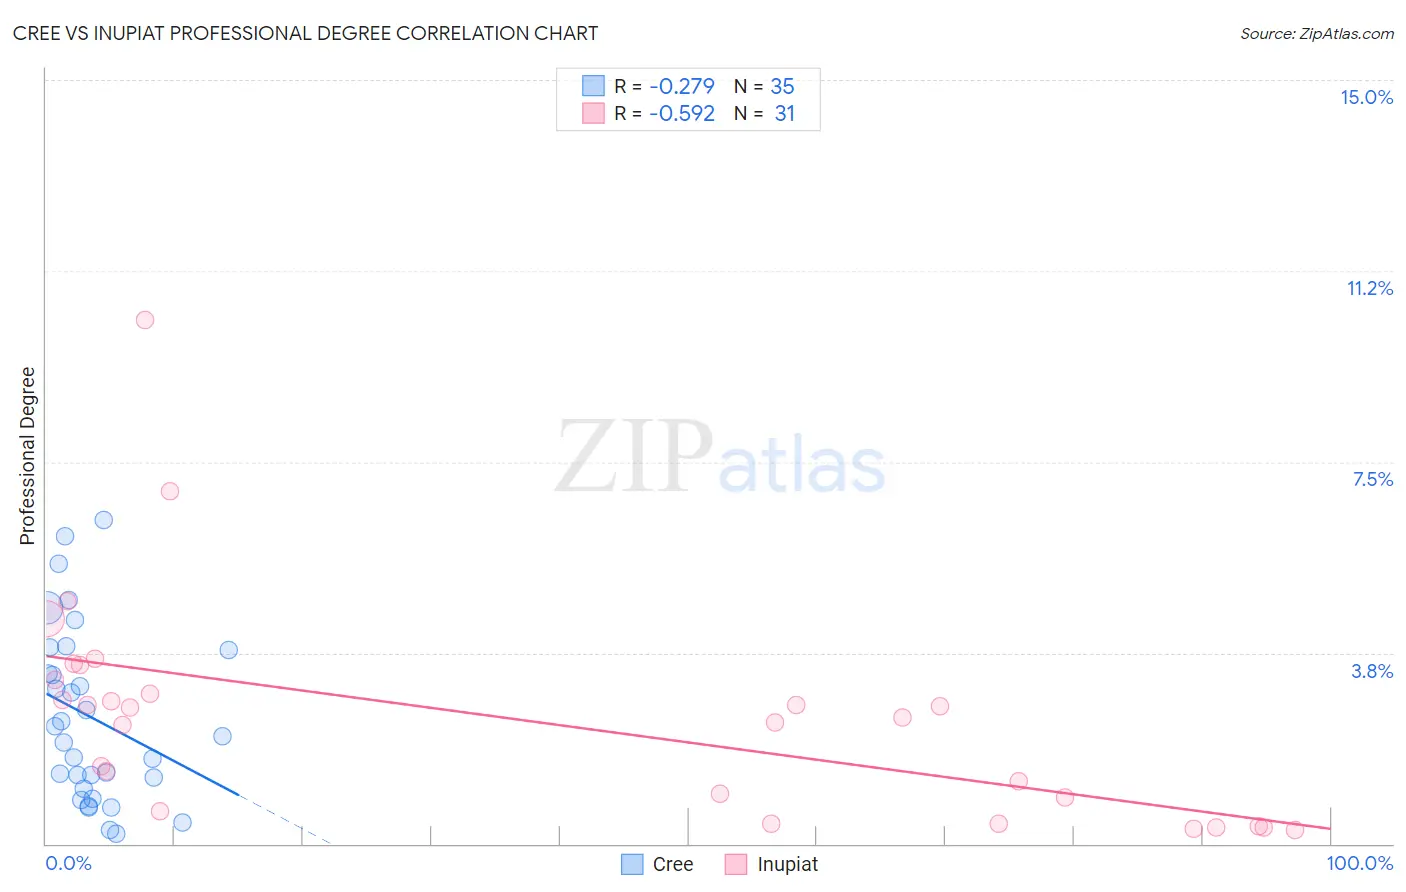
Cree vs Inupiat Professional Degree Correlation Chart
The statistical analysis conducted on geographies consisting of 76,148,984 people shows a weak negative correlation between the proportion of Cree and percentage of population with at least professional degree education in the United States with a correlation coefficient (R) of -0.279 and weighted average of 3.9%. Similarly, the statistical analysis conducted on geographies consisting of 96,206,613 people shows a substantial negative correlation between the proportion of Inupiat and percentage of population with at least professional degree education in the United States with a correlation coefficient (R) of -0.592 and weighted average of 3.2%, a difference of 23.5%.
Professional Degree Correlation Summary
| Measurement | Cree | Inupiat |
| Minimum | 0.20% | 0.27% |
| Maximum | 6.3% | 10.3% |
| Range | 6.1% | 10.0% |
| Mean | 2.5% | 2.4% |
| Median | 2.1% | 2.5% |
| Interquartile 25% (IQ1) | 1.1% | 0.64% |
| Interquartile 75% (IQ3) | 3.8% | 3.2% |
| Interquartile Range (IQR) | 2.7% | 2.6% |
| Standard Deviation (Sample) | 1.7% | 2.1% |
| Standard Deviation (Population) | 1.7% | 2.1% |
Similar Demographics by Professional Degree
Demographics Similar to Cree by Professional Degree
In terms of professional degree, the demographic groups most similar to Cree are Ecuadorian (3.9%, a difference of 0.21%), Immigrants from Philippines (3.9%, a difference of 0.26%), Nonimmigrants (3.9%, a difference of 0.30%), Immigrants from Barbados (3.9%, a difference of 0.31%), and Spanish American (3.9%, a difference of 0.53%).
| Demographics | Rating | Rank | Professional Degree |
| Tlingit-Haida | 6.9 /100 | #225 | Tragic 4.0% |
| German Russians | 6.1 /100 | #226 | Tragic 4.0% |
| Cubans | 5.9 /100 | #227 | Tragic 4.0% |
| Immigrants | West Indies | 5.6 /100 | #228 | Tragic 4.0% |
| Immigrants | Burma/Myanmar | 5.4 /100 | #229 | Tragic 3.9% |
| Nicaraguans | 5.1 /100 | #230 | Tragic 3.9% |
| Ecuadorians | 4.6 /100 | #231 | Tragic 3.9% |
| Cree | 4.3 /100 | #232 | Tragic 3.9% |
| Immigrants | Philippines | 4.1 /100 | #233 | Tragic 3.9% |
| Immigrants | Nonimmigrants | 4.0 /100 | #234 | Tragic 3.9% |
| Immigrants | Barbados | 4.0 /100 | #235 | Tragic 3.9% |
| Spanish Americans | 3.8 /100 | #236 | Tragic 3.9% |
| Immigrants | Trinidad and Tobago | 3.8 /100 | #237 | Tragic 3.9% |
| Colville | 2.6 /100 | #238 | Tragic 3.8% |
| British West Indians | 2.4 /100 | #239 | Tragic 3.8% |
Demographics Similar to Inupiat by Professional Degree
In terms of professional degree, the demographic groups most similar to Inupiat are Hispanic or Latino (3.2%, a difference of 0.080%), Crow (3.2%, a difference of 0.27%), Yaqui (3.2%, a difference of 0.34%), Tsimshian (3.2%, a difference of 0.44%), and Seminole (3.2%, a difference of 0.80%).
| Demographics | Rating | Rank | Professional Degree |
| Puerto Ricans | 0.1 /100 | #316 | Tragic 3.2% |
| Nepalese | 0.1 /100 | #317 | Tragic 3.2% |
| Immigrants | Micronesia | 0.1 /100 | #318 | Tragic 3.2% |
| Choctaw | 0.1 /100 | #319 | Tragic 3.2% |
| Seminole | 0.1 /100 | #320 | Tragic 3.2% |
| Tsimshian | 0.0 /100 | #321 | Tragic 3.2% |
| Hispanics or Latinos | 0.0 /100 | #322 | Tragic 3.2% |
| Inupiat | 0.0 /100 | #323 | Tragic 3.2% |
| Crow | 0.0 /100 | #324 | Tragic 3.2% |
| Yaqui | 0.0 /100 | #325 | Tragic 3.2% |
| Menominee | 0.0 /100 | #326 | Tragic 3.1% |
| Dutch West Indians | 0.0 /100 | #327 | Tragic 3.1% |
| Creek | 0.0 /100 | #328 | Tragic 3.1% |
| Bangladeshis | 0.0 /100 | #329 | Tragic 3.1% |
| Immigrants | Cabo Verde | 0.0 /100 | #330 | Tragic 3.1% |