Marshallese vs Immigrants from Guatemala Professional Degree
COMPARE
Marshallese
Immigrants from Guatemala
Professional Degree
Professional Degree Comparison
Marshallese
Immigrants from Guatemala
3.8%
PROFESSIONAL DEGREE
1.7/ 100
METRIC RATING
246th/ 347
METRIC RANK
3.4%
PROFESSIONAL DEGREE
0.2/ 100
METRIC RATING
295th/ 347
METRIC RANK
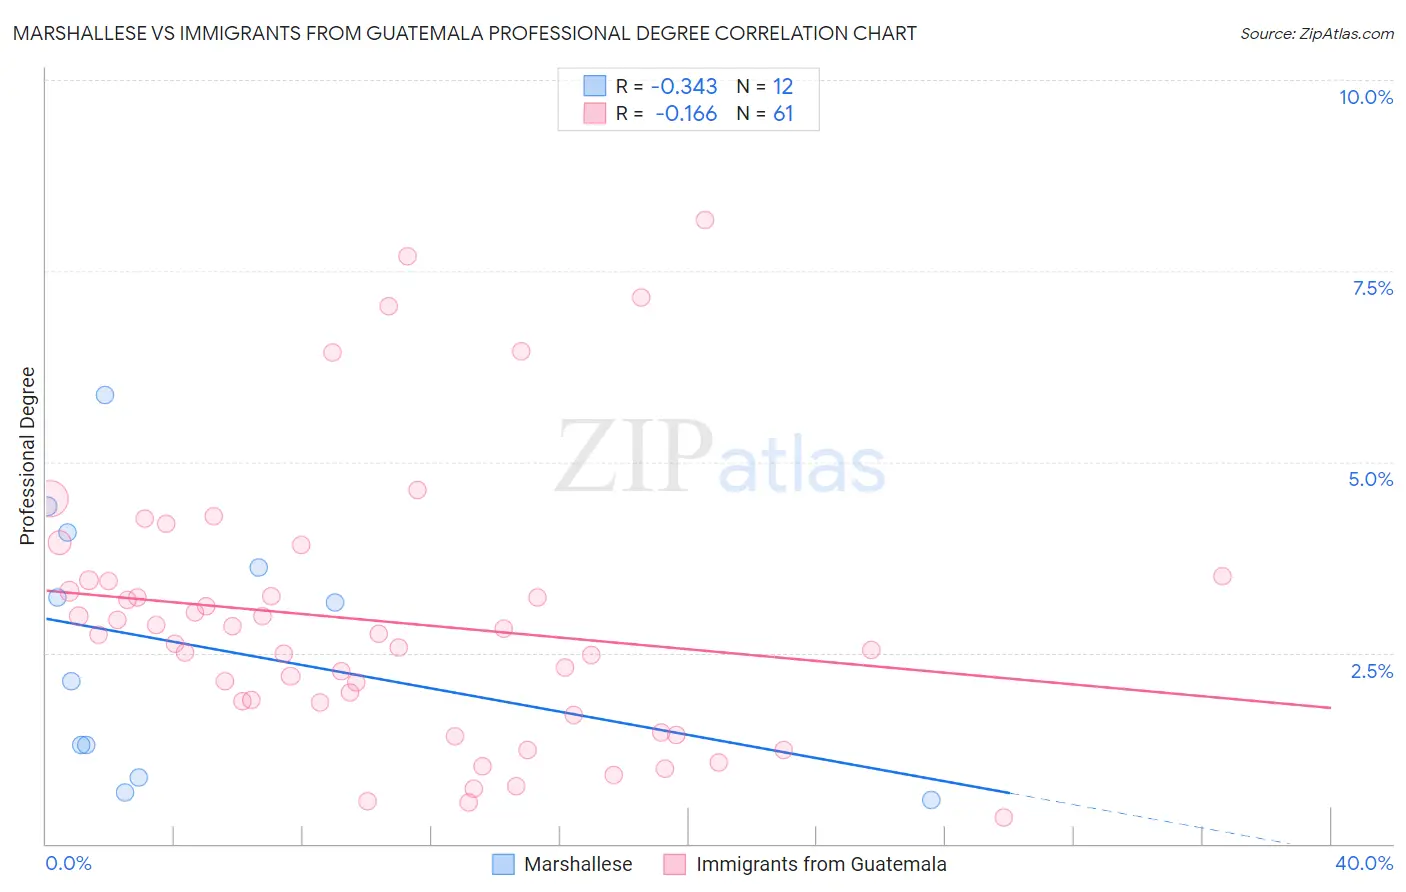
Marshallese vs Immigrants from Guatemala Professional Degree Correlation Chart
The statistical analysis conducted on geographies consisting of 14,750,149 people shows a mild negative correlation between the proportion of Marshallese and percentage of population with at least professional degree education in the United States with a correlation coefficient (R) of -0.343 and weighted average of 3.8%. Similarly, the statistical analysis conducted on geographies consisting of 376,144,765 people shows a poor negative correlation between the proportion of Immigrants from Guatemala and percentage of population with at least professional degree education in the United States with a correlation coefficient (R) of -0.166 and weighted average of 3.4%, a difference of 9.0%.
Professional Degree Correlation Summary
| Measurement | Marshallese | Immigrants from Guatemala |
| Minimum | 0.57% | 0.34% |
| Maximum | 5.9% | 8.2% |
| Range | 5.3% | 7.8% |
| Mean | 2.6% | 2.9% |
| Median | 2.6% | 2.7% |
| Interquartile 25% (IQ1) | 1.1% | 1.8% |
| Interquartile 75% (IQ3) | 3.8% | 3.4% |
| Interquartile Range (IQR) | 2.8% | 1.7% |
| Standard Deviation (Sample) | 1.7% | 1.8% |
| Standard Deviation (Population) | 1.6% | 1.8% |
Similar Demographics by Professional Degree
Demographics Similar to Marshallese by Professional Degree
In terms of professional degree, the demographic groups most similar to Marshallese are Guyanese (3.8%, a difference of 0.020%), French American Indian (3.8%, a difference of 0.17%), Hmong (3.7%, a difference of 0.18%), Immigrants from Grenada (3.7%, a difference of 0.30%), and Immigrants from Fiji (3.7%, a difference of 0.36%).
| Demographics | Rating | Rank | Professional Degree |
| British West Indians | 2.4 /100 | #239 | Tragic 3.8% |
| Immigrants | Ecuador | 2.3 /100 | #240 | Tragic 3.8% |
| Alaskan Athabascans | 2.3 /100 | #241 | Tragic 3.8% |
| Native Hawaiians | 2.3 /100 | #242 | Tragic 3.8% |
| Guamanians/Chamorros | 2.2 /100 | #243 | Tragic 3.8% |
| Immigrants | Bahamas | 2.0 /100 | #244 | Tragic 3.8% |
| French American Indians | 1.7 /100 | #245 | Tragic 3.8% |
| Marshallese | 1.7 /100 | #246 | Tragic 3.8% |
| Guyanese | 1.6 /100 | #247 | Tragic 3.8% |
| Hmong | 1.6 /100 | #248 | Tragic 3.7% |
| Immigrants | Grenada | 1.5 /100 | #249 | Tragic 3.7% |
| Immigrants | Fiji | 1.5 /100 | #250 | Tragic 3.7% |
| Immigrants | Nicaragua | 1.4 /100 | #251 | Tragic 3.7% |
| Jamaicans | 1.4 /100 | #252 | Tragic 3.7% |
| Pueblo | 1.4 /100 | #253 | Tragic 3.7% |
Demographics Similar to Immigrants from Guatemala by Professional Degree
In terms of professional degree, the demographic groups most similar to Immigrants from Guatemala are Hawaiian (3.4%, a difference of 0.010%), Paiute (3.4%, a difference of 0.16%), Immigrants from Honduras (3.5%, a difference of 0.24%), Immigrants from Liberia (3.4%, a difference of 0.35%), and Ottawa (3.4%, a difference of 0.40%).
| Demographics | Rating | Rank | Professional Degree |
| Blackfeet | 0.3 /100 | #288 | Tragic 3.5% |
| Guatemalans | 0.3 /100 | #289 | Tragic 3.5% |
| Chippewa | 0.3 /100 | #290 | Tragic 3.5% |
| Alaska Natives | 0.3 /100 | #291 | Tragic 3.5% |
| Immigrants | Belize | 0.3 /100 | #292 | Tragic 3.5% |
| Immigrants | Honduras | 0.3 /100 | #293 | Tragic 3.5% |
| Paiute | 0.3 /100 | #294 | Tragic 3.4% |
| Immigrants | Guatemala | 0.2 /100 | #295 | Tragic 3.4% |
| Hawaiians | 0.2 /100 | #296 | Tragic 3.4% |
| Immigrants | Liberia | 0.2 /100 | #297 | Tragic 3.4% |
| Ottawa | 0.2 /100 | #298 | Tragic 3.4% |
| Immigrants | Yemen | 0.2 /100 | #299 | Tragic 3.4% |
| Blacks/African Americans | 0.2 /100 | #300 | Tragic 3.4% |
| Immigrants | Dominican Republic | 0.2 /100 | #301 | Tragic 3.4% |
| Malaysians | 0.2 /100 | #302 | Tragic 3.4% |