Taiwanese vs Immigrants from Guatemala Professional Degree
COMPARE
Taiwanese
Immigrants from Guatemala
Professional Degree
Professional Degree Comparison
Taiwanese
Immigrants from Guatemala
5.0%
PROFESSIONAL DEGREE
97.3/ 100
METRIC RATING
112th/ 347
METRIC RANK
3.4%
PROFESSIONAL DEGREE
0.2/ 100
METRIC RATING
295th/ 347
METRIC RANK
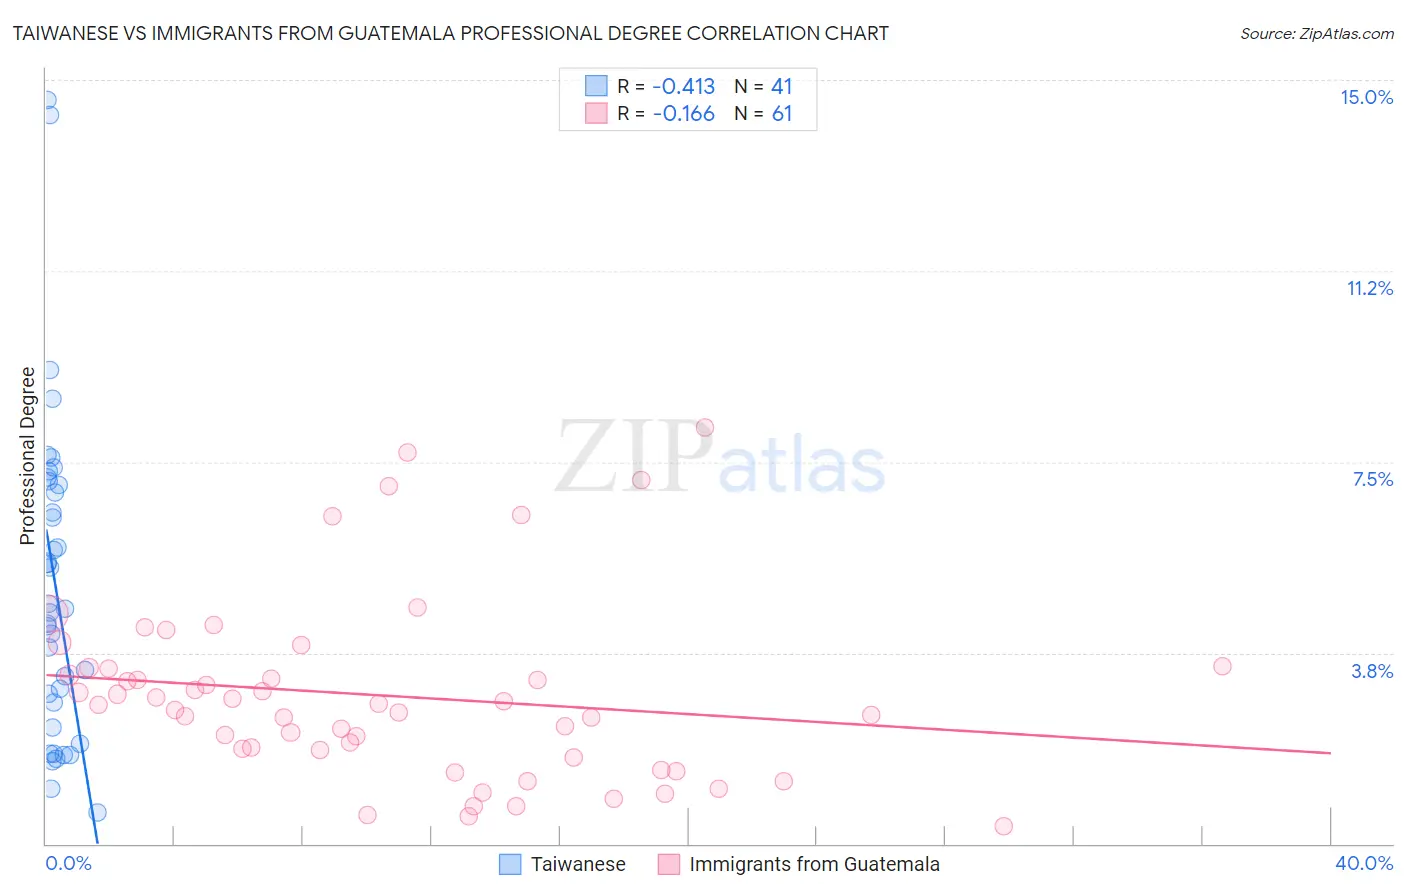
Taiwanese vs Immigrants from Guatemala Professional Degree Correlation Chart
The statistical analysis conducted on geographies consisting of 31,716,094 people shows a moderate negative correlation between the proportion of Taiwanese and percentage of population with at least professional degree education in the United States with a correlation coefficient (R) of -0.413 and weighted average of 5.0%. Similarly, the statistical analysis conducted on geographies consisting of 376,144,765 people shows a poor negative correlation between the proportion of Immigrants from Guatemala and percentage of population with at least professional degree education in the United States with a correlation coefficient (R) of -0.166 and weighted average of 3.4%, a difference of 44.6%.
Professional Degree Correlation Summary
| Measurement | Taiwanese | Immigrants from Guatemala |
| Minimum | 0.61% | 0.34% |
| Maximum | 14.6% | 8.2% |
| Range | 14.0% | 7.8% |
| Mean | 5.1% | 2.9% |
| Median | 4.6% | 2.7% |
| Interquartile 25% (IQ1) | 2.5% | 1.8% |
| Interquartile 75% (IQ3) | 7.1% | 3.4% |
| Interquartile Range (IQR) | 4.6% | 1.7% |
| Standard Deviation (Sample) | 3.2% | 1.8% |
| Standard Deviation (Population) | 3.1% | 1.8% |
Similar Demographics by Professional Degree
Demographics Similar to Taiwanese by Professional Degree
In terms of professional degree, the demographic groups most similar to Taiwanese are Immigrants from Pakistan (5.0%, a difference of 0.020%), Brazilian (5.0%, a difference of 0.22%), Immigrants from Morocco (5.0%, a difference of 0.47%), Moroccan (5.0%, a difference of 0.57%), and Lebanese (5.0%, a difference of 0.96%).
| Demographics | Rating | Rank | Professional Degree |
| Immigrants | Uganda | 98.2 /100 | #105 | Exceptional 5.0% |
| Immigrants | Ukraine | 98.2 /100 | #106 | Exceptional 5.0% |
| Maltese | 98.1 /100 | #107 | Exceptional 5.0% |
| Immigrants | Southern Europe | 98.1 /100 | #108 | Exceptional 5.0% |
| British | 98.0 /100 | #109 | Exceptional 5.0% |
| Lebanese | 98.0 /100 | #110 | Exceptional 5.0% |
| Brazilians | 97.4 /100 | #111 | Exceptional 5.0% |
| Taiwanese | 97.3 /100 | #112 | Exceptional 5.0% |
| Immigrants | Pakistan | 97.2 /100 | #113 | Exceptional 5.0% |
| Immigrants | Morocco | 96.8 /100 | #114 | Exceptional 5.0% |
| Moroccans | 96.8 /100 | #115 | Exceptional 5.0% |
| Venezuelans | 96.3 /100 | #116 | Exceptional 4.9% |
| Immigrants | Syria | 96.0 /100 | #117 | Exceptional 4.9% |
| Croatians | 96.0 /100 | #118 | Exceptional 4.9% |
| Immigrants | Sudan | 95.4 /100 | #119 | Exceptional 4.9% |
Demographics Similar to Immigrants from Guatemala by Professional Degree
In terms of professional degree, the demographic groups most similar to Immigrants from Guatemala are Hawaiian (3.4%, a difference of 0.010%), Paiute (3.4%, a difference of 0.16%), Immigrants from Honduras (3.5%, a difference of 0.24%), Immigrants from Liberia (3.4%, a difference of 0.35%), and Ottawa (3.4%, a difference of 0.40%).
| Demographics | Rating | Rank | Professional Degree |
| Blackfeet | 0.3 /100 | #288 | Tragic 3.5% |
| Guatemalans | 0.3 /100 | #289 | Tragic 3.5% |
| Chippewa | 0.3 /100 | #290 | Tragic 3.5% |
| Alaska Natives | 0.3 /100 | #291 | Tragic 3.5% |
| Immigrants | Belize | 0.3 /100 | #292 | Tragic 3.5% |
| Immigrants | Honduras | 0.3 /100 | #293 | Tragic 3.5% |
| Paiute | 0.3 /100 | #294 | Tragic 3.4% |
| Immigrants | Guatemala | 0.2 /100 | #295 | Tragic 3.4% |
| Hawaiians | 0.2 /100 | #296 | Tragic 3.4% |
| Immigrants | Liberia | 0.2 /100 | #297 | Tragic 3.4% |
| Ottawa | 0.2 /100 | #298 | Tragic 3.4% |
| Immigrants | Yemen | 0.2 /100 | #299 | Tragic 3.4% |
| Blacks/African Americans | 0.2 /100 | #300 | Tragic 3.4% |
| Immigrants | Dominican Republic | 0.2 /100 | #301 | Tragic 3.4% |
| Malaysians | 0.2 /100 | #302 | Tragic 3.4% |