Cree vs Immigrants from Guatemala Cognitive Disability
COMPARE
Cree
Immigrants from Guatemala
Cognitive Disability
Cognitive Disability Comparison
Cree
Immigrants from Guatemala
17.9%
COGNITIVE DISABILITY
0.7/ 100
METRIC RATING
249th/ 347
METRIC RANK
17.7%
COGNITIVE DISABILITY
2.2/ 100
METRIC RATING
229th/ 347
METRIC RANK
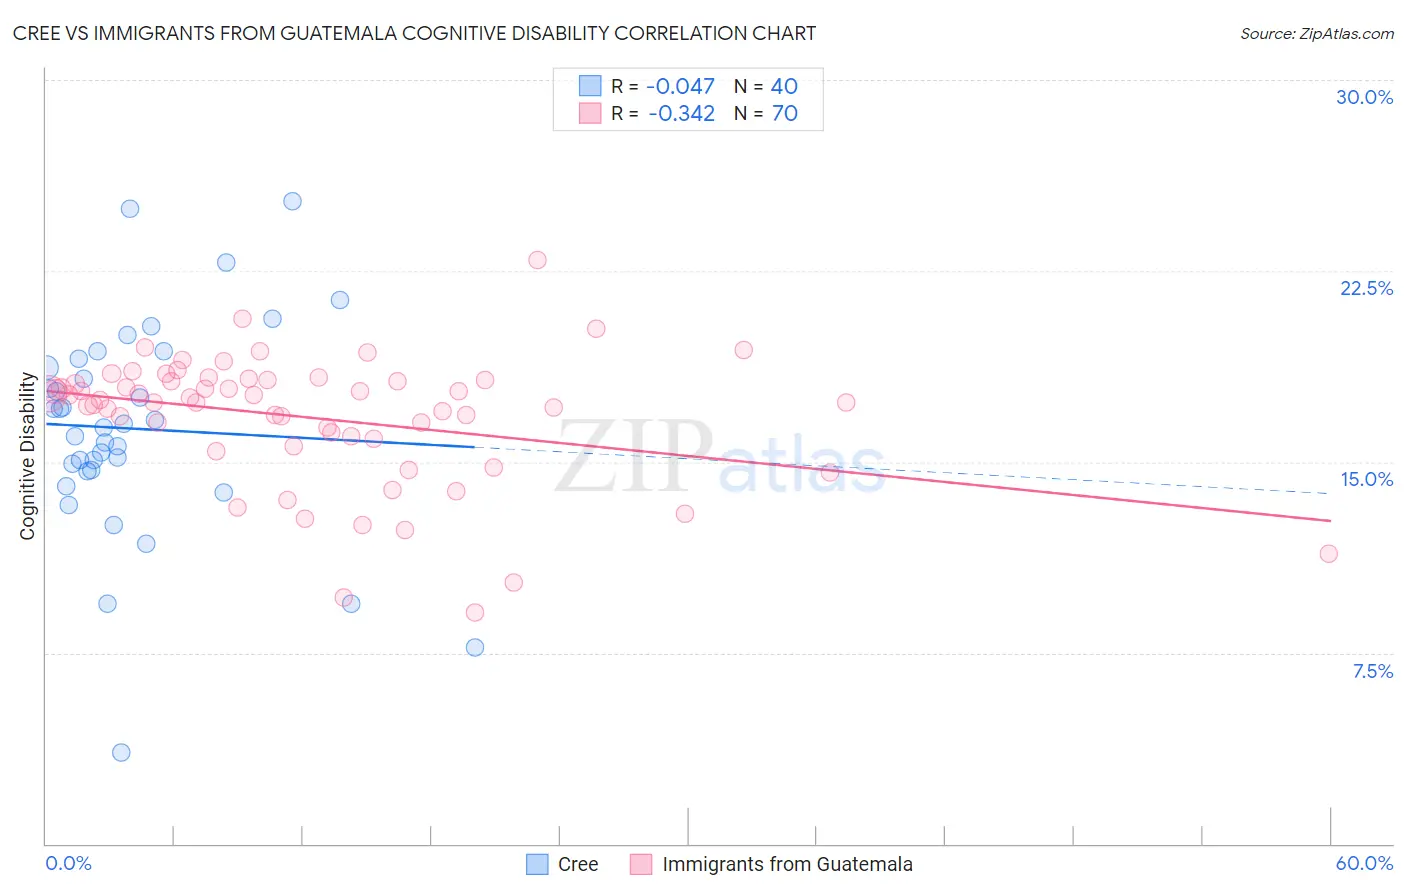
Cree vs Immigrants from Guatemala Cognitive Disability Correlation Chart
The statistical analysis conducted on geographies consisting of 76,210,632 people shows no correlation between the proportion of Cree and percentage of population with cognitive disability in the United States with a correlation coefficient (R) of -0.047 and weighted average of 17.9%. Similarly, the statistical analysis conducted on geographies consisting of 377,233,463 people shows a mild negative correlation between the proportion of Immigrants from Guatemala and percentage of population with cognitive disability in the United States with a correlation coefficient (R) of -0.342 and weighted average of 17.7%, a difference of 0.87%.
Cognitive Disability Correlation Summary
| Measurement | Cree | Immigrants from Guatemala |
| Minimum | 3.6% | 9.1% |
| Maximum | 25.2% | 22.9% |
| Range | 21.7% | 13.8% |
| Mean | 16.3% | 16.7% |
| Median | 16.4% | 17.4% |
| Interquartile 25% (IQ1) | 14.7% | 15.9% |
| Interquartile 75% (IQ3) | 18.9% | 18.2% |
| Interquartile Range (IQR) | 4.2% | 2.3% |
| Standard Deviation (Sample) | 4.3% | 2.6% |
| Standard Deviation (Population) | 4.2% | 2.5% |
Demographics Similar to Cree and Immigrants from Guatemala by Cognitive Disability
In terms of cognitive disability, the demographic groups most similar to Cree are French American Indian (17.9%, a difference of 0.050%), Samoan (17.9%, a difference of 0.060%), Immigrants from Thailand (17.9%, a difference of 0.13%), Trinidadian and Tobagonian (17.9%, a difference of 0.15%), and Jamaican (17.9%, a difference of 0.25%). Similarly, the demographic groups most similar to Immigrants from Guatemala are Mongolian (17.7%, a difference of 0.020%), Guatemalan (17.8%, a difference of 0.060%), Tongan (17.8%, a difference of 0.060%), Panamanian (17.8%, a difference of 0.060%), and Osage (17.8%, a difference of 0.080%).
| Demographics | Rating | Rank | Cognitive Disability |
| Immigrants | Guatemala | 2.2 /100 | #229 | Tragic 17.7% |
| Mongolians | 2.2 /100 | #230 | Tragic 17.7% |
| Guatemalans | 2.1 /100 | #231 | Tragic 17.8% |
| Tongans | 2.1 /100 | #232 | Tragic 17.8% |
| Panamanians | 2.1 /100 | #233 | Tragic 17.8% |
| Osage | 2.0 /100 | #234 | Tragic 17.8% |
| Spanish American Indians | 2.0 /100 | #235 | Tragic 17.8% |
| Immigrants | Iraq | 1.8 /100 | #236 | Tragic 17.8% |
| Immigrants | Mexico | 1.8 /100 | #237 | Tragic 17.8% |
| Cheyenne | 1.7 /100 | #238 | Tragic 17.8% |
| Cajuns | 1.4 /100 | #239 | Tragic 17.8% |
| Iraqis | 1.4 /100 | #240 | Tragic 17.8% |
| Mexicans | 1.1 /100 | #241 | Tragic 17.8% |
| Paiute | 1.1 /100 | #242 | Tragic 17.8% |
| Immigrants | Bangladesh | 1.0 /100 | #243 | Tragic 17.8% |
| Jamaicans | 0.9 /100 | #244 | Tragic 17.9% |
| Trinidadians and Tobagonians | 0.8 /100 | #245 | Tragic 17.9% |
| Immigrants | Thailand | 0.8 /100 | #246 | Tragic 17.9% |
| Samoans | 0.7 /100 | #247 | Tragic 17.9% |
| French American Indians | 0.7 /100 | #248 | Tragic 17.9% |
| Cree | 0.7 /100 | #249 | Tragic 17.9% |