Cree vs Immigrants from Guatemala Male Disability
COMPARE
Cree
Immigrants from Guatemala
Male Disability
Male Disability Comparison
Cree
Immigrants from Guatemala
13.7%
MALE DISABILITY
0.0/ 100
METRIC RATING
318th/ 347
METRIC RANK
11.0%
MALE DISABILITY
75.1/ 100
METRIC RATING
150th/ 347
METRIC RANK
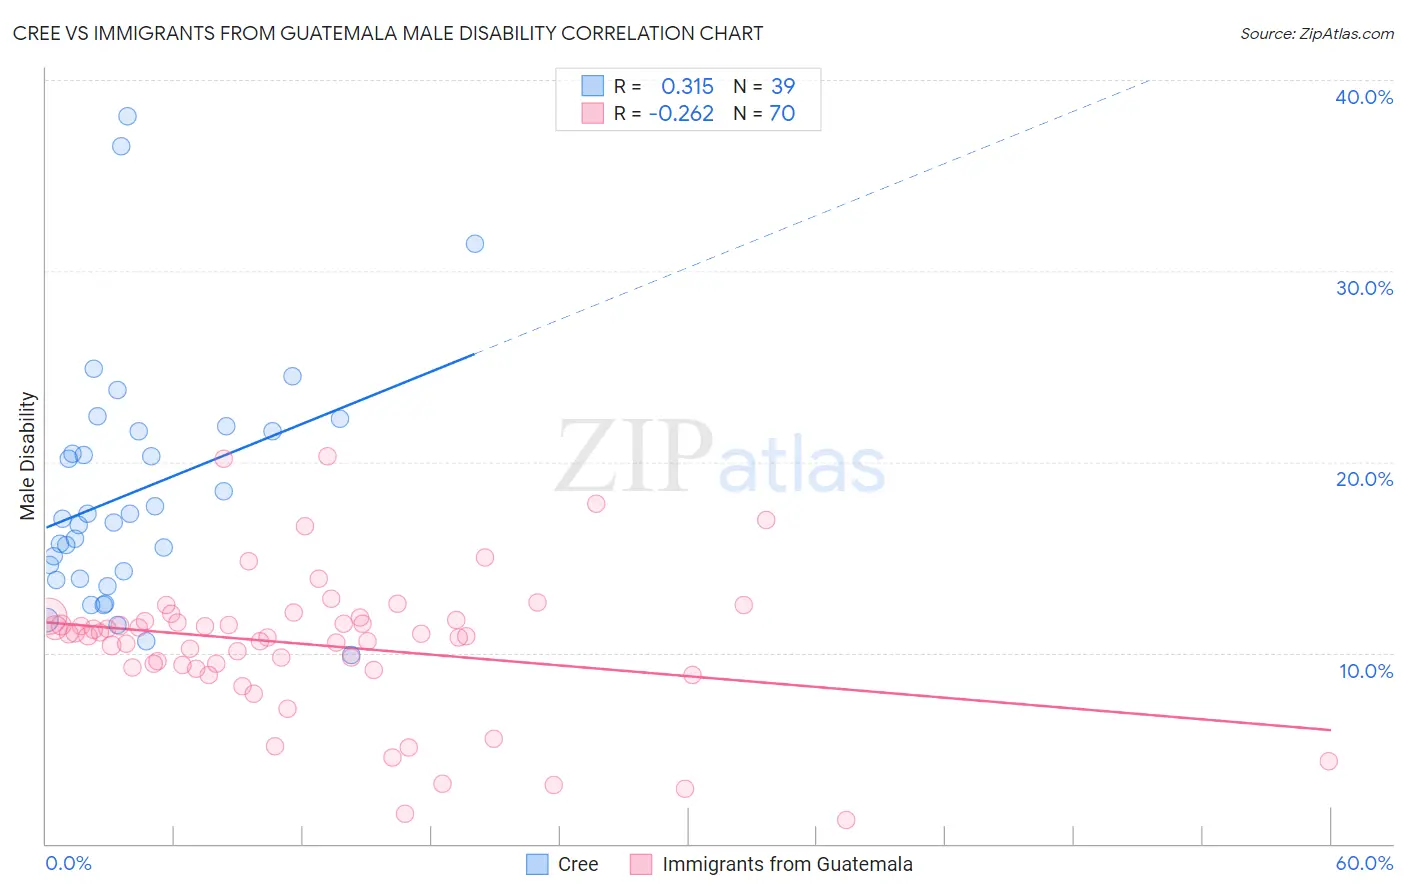
Cree vs Immigrants from Guatemala Male Disability Correlation Chart
The statistical analysis conducted on geographies consisting of 76,208,606 people shows a mild positive correlation between the proportion of Cree and percentage of males with a disability in the United States with a correlation coefficient (R) of 0.315 and weighted average of 13.7%. Similarly, the statistical analysis conducted on geographies consisting of 377,223,661 people shows a weak negative correlation between the proportion of Immigrants from Guatemala and percentage of males with a disability in the United States with a correlation coefficient (R) of -0.262 and weighted average of 11.0%, a difference of 24.2%.
Male Disability Correlation Summary
| Measurement | Cree | Immigrants from Guatemala |
| Minimum | 9.9% | 1.3% |
| Maximum | 38.1% | 20.3% |
| Range | 28.2% | 19.1% |
| Mean | 18.5% | 10.4% |
| Median | 17.0% | 10.9% |
| Interquartile 25% (IQ1) | 13.9% | 9.2% |
| Interquartile 75% (IQ3) | 21.6% | 11.7% |
| Interquartile Range (IQR) | 7.7% | 2.5% |
| Standard Deviation (Sample) | 6.4% | 3.7% |
| Standard Deviation (Population) | 6.3% | 3.7% |
Similar Demographics by Male Disability
Demographics Similar to Cree by Male Disability
In terms of male disability, the demographic groups most similar to Cree are Paiute (13.7%, a difference of 0.21%), American (13.8%, a difference of 0.41%), Tlingit-Haida (13.8%, a difference of 0.90%), Shoshone (13.8%, a difference of 0.96%), and Alaska Native (13.6%, a difference of 1.0%).
| Demographics | Rating | Rank | Male Disability |
| Delaware | 0.0 /100 | #311 | Tragic 13.5% |
| Yakama | 0.0 /100 | #312 | Tragic 13.5% |
| Puget Sound Salish | 0.0 /100 | #313 | Tragic 13.5% |
| Aleuts | 0.0 /100 | #314 | Tragic 13.5% |
| Iroquois | 0.0 /100 | #315 | Tragic 13.6% |
| Alaska Natives | 0.0 /100 | #316 | Tragic 13.6% |
| Paiute | 0.0 /100 | #317 | Tragic 13.7% |
| Cree | 0.0 /100 | #318 | Tragic 13.7% |
| Americans | 0.0 /100 | #319 | Tragic 13.8% |
| Tlingit-Haida | 0.0 /100 | #320 | Tragic 13.8% |
| Shoshone | 0.0 /100 | #321 | Tragic 13.8% |
| Apache | 0.0 /100 | #322 | Tragic 14.0% |
| Osage | 0.0 /100 | #323 | Tragic 14.0% |
| Comanche | 0.0 /100 | #324 | Tragic 14.1% |
| Ottawa | 0.0 /100 | #325 | Tragic 14.1% |
Demographics Similar to Immigrants from Guatemala by Male Disability
In terms of male disability, the demographic groups most similar to Immigrants from Guatemala are Cuban (11.0%, a difference of 0.020%), Immigrants from Albania (11.0%, a difference of 0.050%), Immigrants from Denmark (11.0%, a difference of 0.10%), Immigrants from Northern Europe (11.1%, a difference of 0.14%), and Sudanese (11.0%, a difference of 0.15%).
| Demographics | Rating | Rank | Male Disability |
| Moroccans | 80.7 /100 | #143 | Excellent 11.0% |
| Kenyans | 78.1 /100 | #144 | Good 11.0% |
| Costa Ricans | 78.0 /100 | #145 | Good 11.0% |
| Koreans | 77.5 /100 | #146 | Good 11.0% |
| Immigrants | Croatia | 77.3 /100 | #147 | Good 11.0% |
| Sudanese | 77.1 /100 | #148 | Good 11.0% |
| Immigrants | Denmark | 76.4 /100 | #149 | Good 11.0% |
| Immigrants | Guatemala | 75.1 /100 | #150 | Good 11.0% |
| Cubans | 74.9 /100 | #151 | Good 11.0% |
| Immigrants | Albania | 74.4 /100 | #152 | Good 11.0% |
| Immigrants | Northern Europe | 73.2 /100 | #153 | Good 11.1% |
| Immigrants | Moldova | 72.8 /100 | #154 | Good 11.1% |
| Immigrants | Middle Africa | 70.9 /100 | #155 | Good 11.1% |
| Russians | 69.8 /100 | #156 | Good 11.1% |
| Immigrants | Western Africa | 69.2 /100 | #157 | Good 11.1% |