Costa Rican vs Mexican Female Poverty Among 25-34 Year Olds
COMPARE
Costa Rican
Mexican
Female Poverty Among 25-34 Year Olds
Female Poverty Among 25-34 Year Olds Comparison
Costa Ricans
Mexicans
13.2%
FEMALE POVERTY AMONG 25-34 YEAR OLDS
75.8/ 100
METRIC RATING
151st/ 347
METRIC RANK
16.6%
FEMALE POVERTY AMONG 25-34 YEAR OLDS
0.0/ 100
METRIC RATING
295th/ 347
METRIC RANK
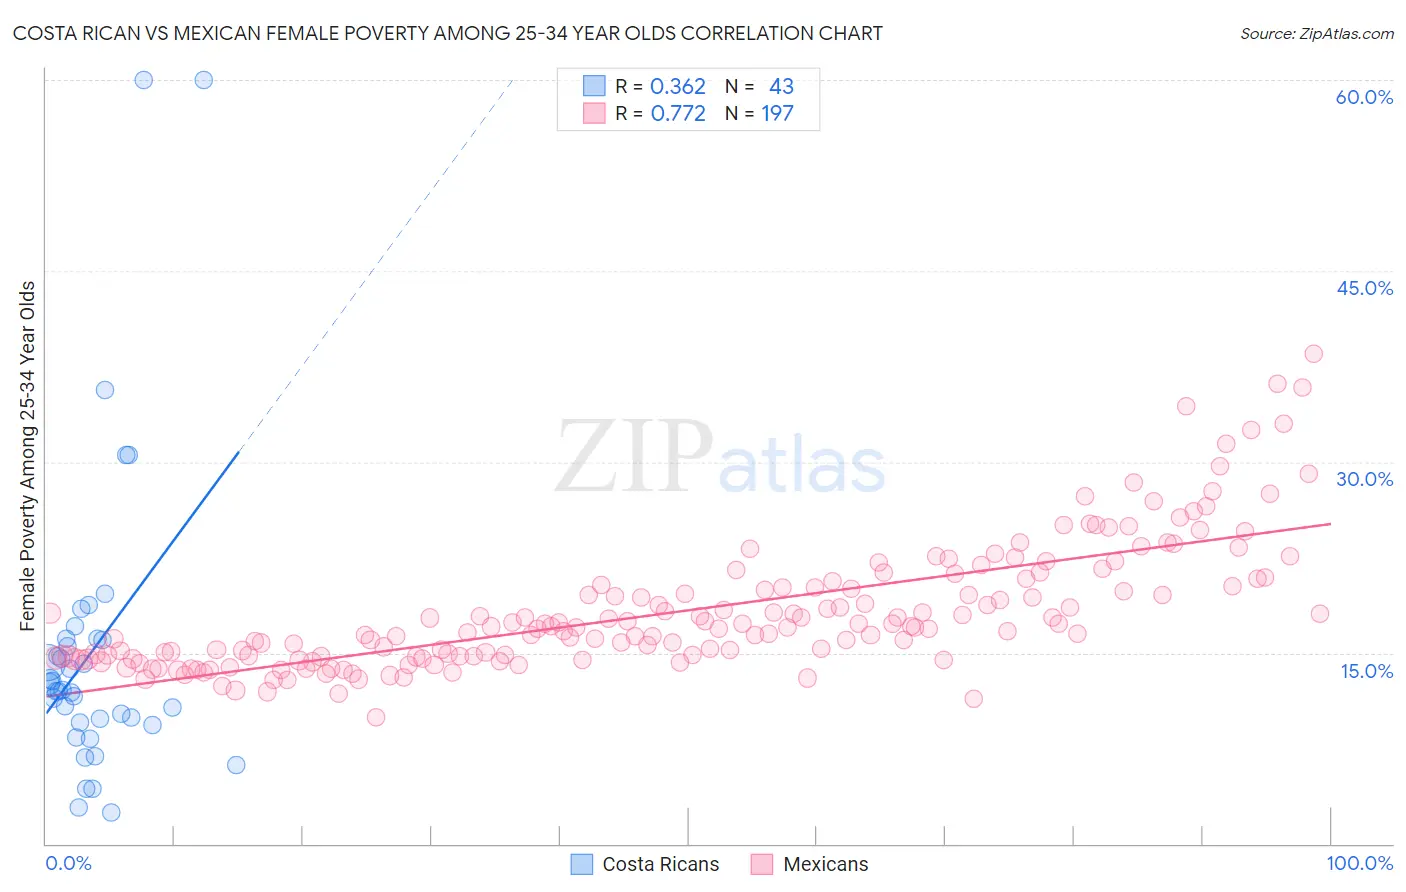
Costa Rican vs Mexican Female Poverty Among 25-34 Year Olds Correlation Chart
The statistical analysis conducted on geographies consisting of 251,732,871 people shows a mild positive correlation between the proportion of Costa Ricans and poverty level among females between the ages 25 and 34 in the United States with a correlation coefficient (R) of 0.362 and weighted average of 13.2%. Similarly, the statistical analysis conducted on geographies consisting of 546,296,025 people shows a strong positive correlation between the proportion of Mexicans and poverty level among females between the ages 25 and 34 in the United States with a correlation coefficient (R) of 0.772 and weighted average of 16.6%, a difference of 25.5%.
Female Poverty Among 25-34 Year Olds Correlation Summary
| Measurement | Costa Rican | Mexican |
| Minimum | 2.5% | 10.0% |
| Maximum | 60.0% | 38.5% |
| Range | 57.5% | 28.5% |
| Mean | 15.2% | 18.3% |
| Median | 12.1% | 17.0% |
| Interquartile 25% (IQ1) | 9.5% | 14.7% |
| Interquartile 75% (IQ3) | 16.1% | 20.3% |
| Interquartile Range (IQR) | 6.5% | 5.6% |
| Standard Deviation (Sample) | 12.1% | 5.0% |
| Standard Deviation (Population) | 11.9% | 5.0% |
Similar Demographics by Female Poverty Among 25-34 Year Olds
Demographics Similar to Costa Ricans by Female Poverty Among 25-34 Year Olds
In terms of female poverty among 25-34 year olds, the demographic groups most similar to Costa Ricans are Slavic (13.2%, a difference of 0.010%), Iraqi (13.2%, a difference of 0.030%), Sierra Leonean (13.2%, a difference of 0.050%), European (13.2%, a difference of 0.12%), and Lebanese (13.2%, a difference of 0.12%).
| Demographics | Rating | Rank | Female Poverty Among 25-34 Year Olds |
| Native Hawaiians | 78.9 /100 | #144 | Good 13.2% |
| Colombians | 77.2 /100 | #145 | Good 13.2% |
| South Americans | 76.9 /100 | #146 | Good 13.2% |
| Europeans | 76.8 /100 | #147 | Good 13.2% |
| Lebanese | 76.8 /100 | #148 | Good 13.2% |
| Sierra Leoneans | 76.3 /100 | #149 | Good 13.2% |
| Iraqis | 76.0 /100 | #150 | Good 13.2% |
| Costa Ricans | 75.8 /100 | #151 | Good 13.2% |
| Slavs | 75.7 /100 | #152 | Good 13.2% |
| Northern Europeans | 73.7 /100 | #153 | Good 13.2% |
| Arabs | 73.5 /100 | #154 | Good 13.2% |
| Immigrants | Sierra Leone | 72.9 /100 | #155 | Good 13.3% |
| Immigrants | Cameroon | 72.0 /100 | #156 | Good 13.3% |
| Immigrants | Western Europe | 70.3 /100 | #157 | Good 13.3% |
| Immigrants | Colombia | 69.2 /100 | #158 | Good 13.3% |
Demographics Similar to Mexicans by Female Poverty Among 25-34 Year Olds
In terms of female poverty among 25-34 year olds, the demographic groups most similar to Mexicans are Immigrants from Central America (16.6%, a difference of 0.080%), Hispanic or Latino (16.6%, a difference of 0.20%), Immigrants from Guatemala (16.6%, a difference of 0.26%), Potawatomi (16.5%, a difference of 0.44%), and Immigrants from Dominica (16.5%, a difference of 0.71%).
| Demographics | Rating | Rank | Female Poverty Among 25-34 Year Olds |
| Guatemalans | 0.0 /100 | #288 | Tragic 16.4% |
| Osage | 0.0 /100 | #289 | Tragic 16.4% |
| Indonesians | 0.0 /100 | #290 | Tragic 16.4% |
| Comanche | 0.0 /100 | #291 | Tragic 16.5% |
| Immigrants | Dominica | 0.0 /100 | #292 | Tragic 16.5% |
| Potawatomi | 0.0 /100 | #293 | Tragic 16.5% |
| Immigrants | Central America | 0.0 /100 | #294 | Tragic 16.6% |
| Mexicans | 0.0 /100 | #295 | Tragic 16.6% |
| Hispanics or Latinos | 0.0 /100 | #296 | Tragic 16.6% |
| Immigrants | Guatemala | 0.0 /100 | #297 | Tragic 16.6% |
| Blackfeet | 0.0 /100 | #298 | Tragic 16.7% |
| Spanish Americans | 0.0 /100 | #299 | Tragic 16.7% |
| U.S. Virgin Islanders | 0.0 /100 | #300 | Tragic 16.7% |
| Immigrants | Congo | 0.0 /100 | #301 | Tragic 16.7% |
| Alaska Natives | 0.0 /100 | #302 | Tragic 16.8% |