British West Indian vs Mexican College, 1 year or more
COMPARE
British West Indian
Mexican
College, 1 year or more
College, 1 year or more Comparison
British West Indians
Mexicans
54.5%
COLLEGE, 1 YEAR OR MORE
0.2/ 100
METRIC RATING
268th/ 347
METRIC RANK
49.2%
COLLEGE, 1 YEAR OR MORE
0.0/ 100
METRIC RATING
332nd/ 347
METRIC RANK
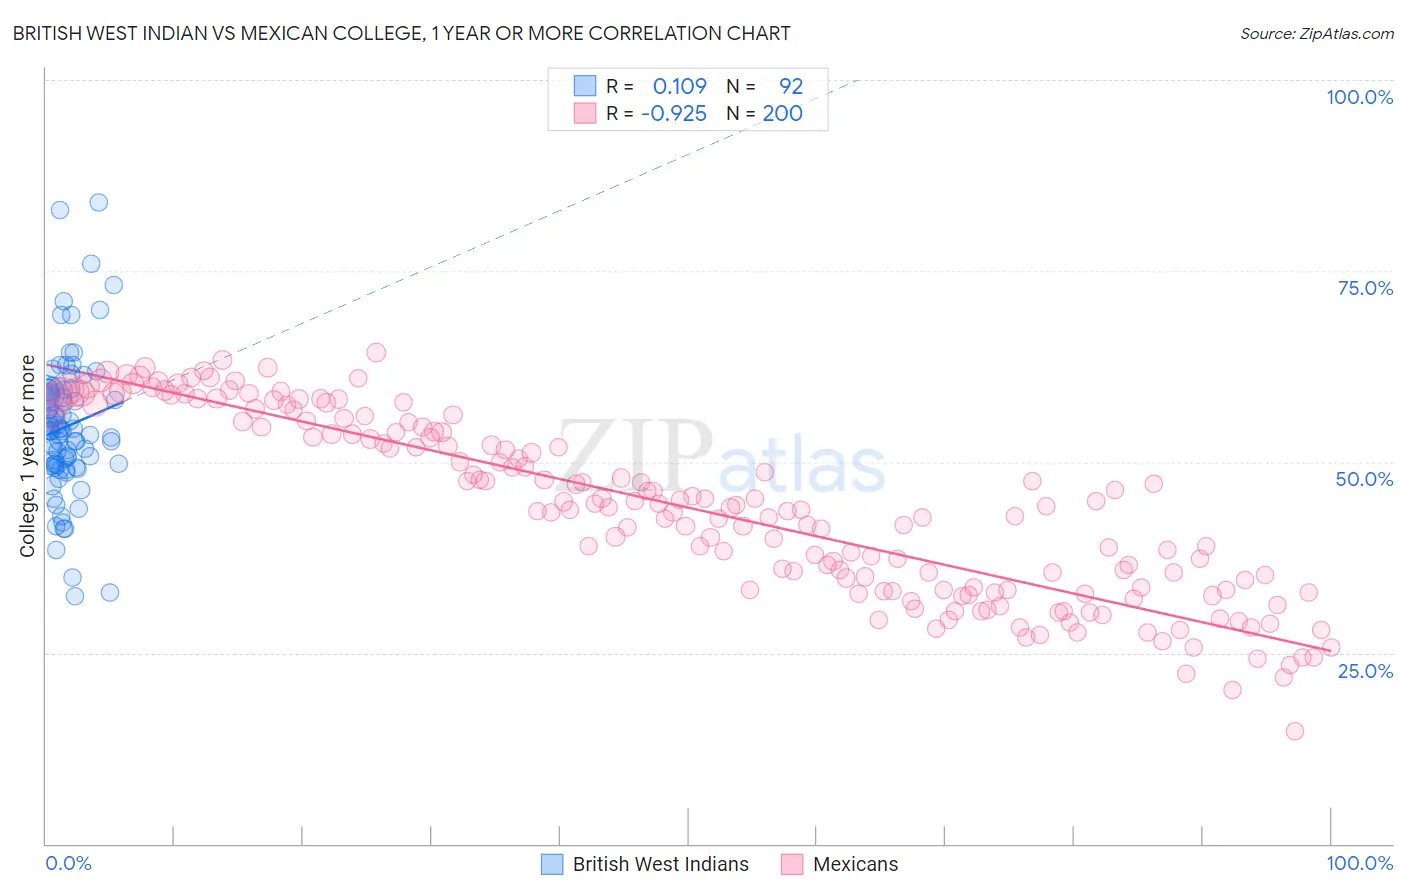
British West Indian vs Mexican College, 1 year or more Correlation Chart
The statistical analysis conducted on geographies consisting of 152,694,627 people shows a poor positive correlation between the proportion of British West Indians and percentage of population with at least college, 1 year or more education in the United States with a correlation coefficient (R) of 0.109 and weighted average of 54.5%. Similarly, the statistical analysis conducted on geographies consisting of 565,315,068 people shows a near-perfect negative correlation between the proportion of Mexicans and percentage of population with at least college, 1 year or more education in the United States with a correlation coefficient (R) of -0.925 and weighted average of 49.2%, a difference of 10.8%.
College, 1 year or more Correlation Summary
| Measurement | British West Indian | Mexican |
| Minimum | 32.4% | 14.7% |
| Maximum | 84.0% | 64.4% |
| Range | 51.6% | 49.6% |
| Mean | 54.6% | 44.0% |
| Median | 54.1% | 44.1% |
| Interquartile 25% (IQ1) | 49.6% | 33.3% |
| Interquartile 75% (IQ3) | 59.2% | 54.9% |
| Interquartile Range (IQR) | 9.6% | 21.6% |
| Standard Deviation (Sample) | 9.2% | 11.7% |
| Standard Deviation (Population) | 9.1% | 11.7% |
Similar Demographics by College, 1 year or more
Demographics Similar to British West Indians by College, 1 year or more
In terms of college, 1 year or more, the demographic groups most similar to British West Indians are Bangladeshi (54.5%, a difference of 0.030%), Crow (54.5%, a difference of 0.070%), Bahamian (54.5%, a difference of 0.090%), Comanche (54.4%, a difference of 0.14%), and Blackfeet (54.6%, a difference of 0.16%).
| Demographics | Rating | Rank | College, 1 year or more |
| Ottawa | 0.3 /100 | #261 | Tragic 54.9% |
| Immigrants | St. Vincent and the Grenadines | 0.3 /100 | #262 | Tragic 54.8% |
| U.S. Virgin Islanders | 0.3 /100 | #263 | Tragic 54.8% |
| Immigrants | Micronesia | 0.3 /100 | #264 | Tragic 54.8% |
| Immigrants | Laos | 0.2 /100 | #265 | Tragic 54.7% |
| Potawatomi | 0.2 /100 | #266 | Tragic 54.6% |
| Blackfeet | 0.2 /100 | #267 | Tragic 54.6% |
| British West Indians | 0.2 /100 | #268 | Tragic 54.5% |
| Bangladeshis | 0.2 /100 | #269 | Tragic 54.5% |
| Crow | 0.2 /100 | #270 | Tragic 54.5% |
| Bahamians | 0.2 /100 | #271 | Tragic 54.5% |
| Comanche | 0.2 /100 | #272 | Tragic 54.4% |
| Immigrants | Grenada | 0.2 /100 | #273 | Tragic 54.4% |
| Belizeans | 0.2 /100 | #274 | Tragic 54.4% |
| Americans | 0.2 /100 | #275 | Tragic 54.4% |
Demographics Similar to Mexicans by College, 1 year or more
In terms of college, 1 year or more, the demographic groups most similar to Mexicans are Immigrants from Dominican Republic (49.1%, a difference of 0.17%), Lumbee (48.9%, a difference of 0.75%), Yuman (48.7%, a difference of 1.0%), Spanish American Indian (48.5%, a difference of 1.5%), and Pennsylvania German (48.5%, a difference of 1.5%).
| Demographics | Rating | Rank | College, 1 year or more |
| Immigrants | Latin America | 0.0 /100 | #325 | Tragic 50.7% |
| Dominicans | 0.0 /100 | #326 | Tragic 50.6% |
| Menominee | 0.0 /100 | #327 | Tragic 50.6% |
| Dutch West Indians | 0.0 /100 | #328 | Tragic 50.5% |
| Cape Verdeans | 0.0 /100 | #329 | Tragic 50.3% |
| Natives/Alaskans | 0.0 /100 | #330 | Tragic 50.2% |
| Immigrants | Yemen | 0.0 /100 | #331 | Tragic 50.0% |
| Mexicans | 0.0 /100 | #332 | Tragic 49.2% |
| Immigrants | Dominican Republic | 0.0 /100 | #333 | Tragic 49.1% |
| Lumbee | 0.0 /100 | #334 | Tragic 48.9% |
| Yuman | 0.0 /100 | #335 | Tragic 48.7% |
| Spanish American Indians | 0.0 /100 | #336 | Tragic 48.5% |
| Pennsylvania Germans | 0.0 /100 | #337 | Tragic 48.5% |
| Immigrants | Central America | 0.0 /100 | #338 | Tragic 48.5% |
| Immigrants | Azores | 0.0 /100 | #339 | Tragic 48.4% |