Bhutanese vs Mexican College, 1 year or more
COMPARE
Bhutanese
Mexican
College, 1 year or more
College, 1 year or more Comparison
Bhutanese
Mexicans
64.6%
COLLEGE, 1 YEAR OR MORE
99.9/ 100
METRIC RATING
46th/ 347
METRIC RANK
49.2%
COLLEGE, 1 YEAR OR MORE
0.0/ 100
METRIC RATING
332nd/ 347
METRIC RANK
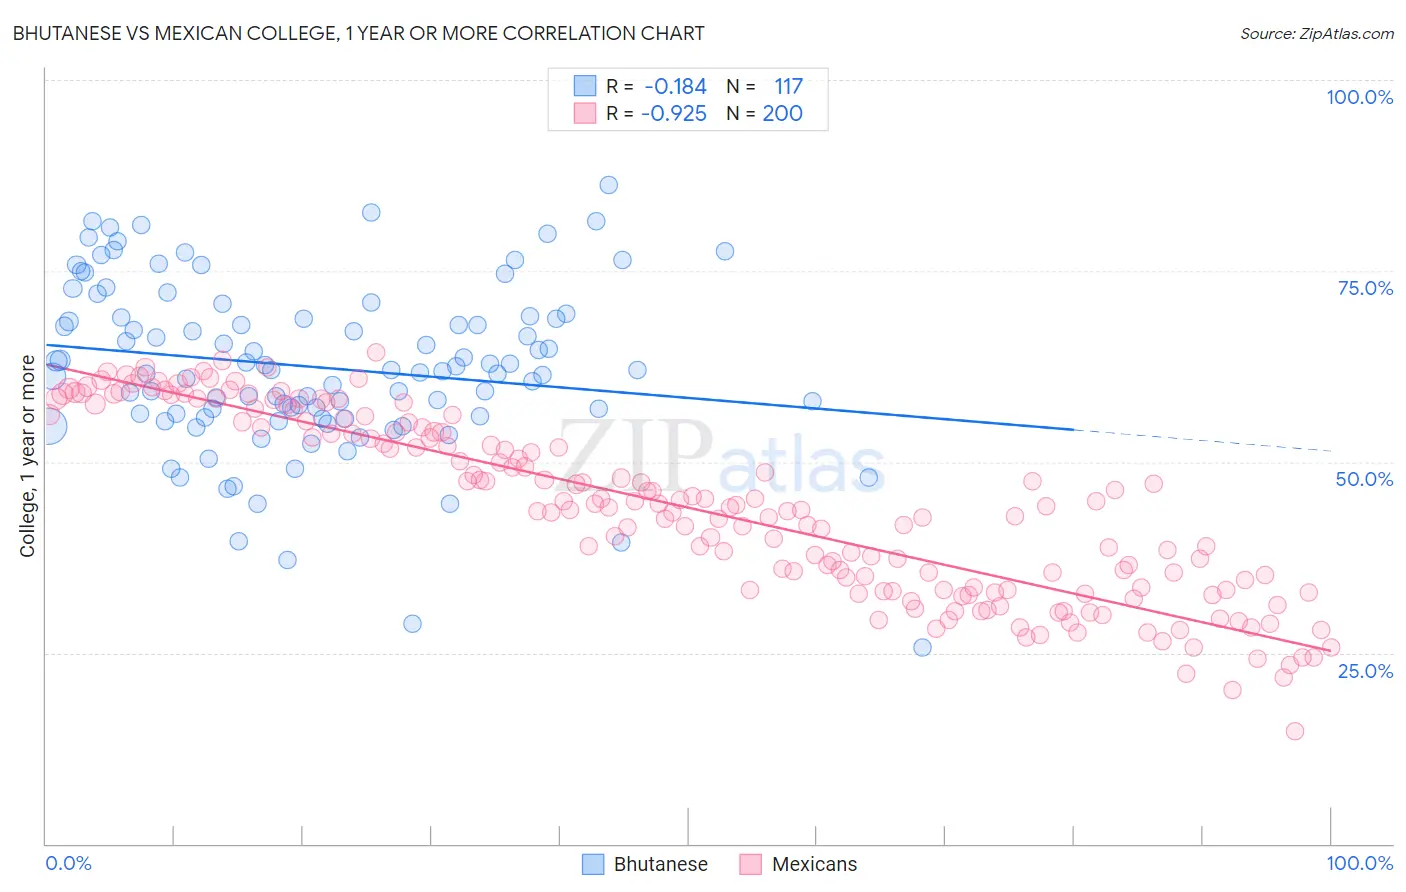
Bhutanese vs Mexican College, 1 year or more Correlation Chart
The statistical analysis conducted on geographies consisting of 455,588,587 people shows a poor negative correlation between the proportion of Bhutanese and percentage of population with at least college, 1 year or more education in the United States with a correlation coefficient (R) of -0.184 and weighted average of 64.6%. Similarly, the statistical analysis conducted on geographies consisting of 565,315,068 people shows a near-perfect negative correlation between the proportion of Mexicans and percentage of population with at least college, 1 year or more education in the United States with a correlation coefficient (R) of -0.925 and weighted average of 49.2%, a difference of 31.3%.
College, 1 year or more Correlation Summary
| Measurement | Bhutanese | Mexican |
| Minimum | 25.7% | 14.7% |
| Maximum | 86.2% | 64.4% |
| Range | 60.5% | 49.6% |
| Mean | 62.4% | 44.0% |
| Median | 62.0% | 44.1% |
| Interquartile 25% (IQ1) | 55.9% | 33.3% |
| Interquartile 75% (IQ3) | 69.0% | 54.9% |
| Interquartile Range (IQR) | 13.0% | 21.6% |
| Standard Deviation (Sample) | 11.1% | 11.7% |
| Standard Deviation (Population) | 11.1% | 11.7% |
Similar Demographics by College, 1 year or more
Demographics Similar to Bhutanese by College, 1 year or more
In terms of college, 1 year or more, the demographic groups most similar to Bhutanese are Immigrants from Lithuania (64.6%, a difference of 0.010%), Australian (64.6%, a difference of 0.010%), Immigrants from Bulgaria (64.6%, a difference of 0.040%), New Zealander (64.6%, a difference of 0.070%), and Immigrants from Norway (64.7%, a difference of 0.18%).
| Demographics | Rating | Rank | College, 1 year or more |
| Estonians | 99.9 /100 | #39 | Exceptional 65.0% |
| Immigrants | Kuwait | 99.9 /100 | #40 | Exceptional 65.0% |
| Mongolians | 99.9 /100 | #41 | Exceptional 64.8% |
| Immigrants | Latvia | 99.9 /100 | #42 | Exceptional 64.8% |
| Immigrants | Russia | 99.9 /100 | #43 | Exceptional 64.7% |
| Immigrants | Norway | 99.9 /100 | #44 | Exceptional 64.7% |
| Immigrants | Lithuania | 99.9 /100 | #45 | Exceptional 64.6% |
| Bhutanese | 99.9 /100 | #46 | Exceptional 64.6% |
| Australians | 99.9 /100 | #47 | Exceptional 64.6% |
| Immigrants | Bulgaria | 99.9 /100 | #48 | Exceptional 64.6% |
| New Zealanders | 99.9 /100 | #49 | Exceptional 64.6% |
| Immigrants | Austria | 99.8 /100 | #50 | Exceptional 64.4% |
| Immigrants | Malaysia | 99.8 /100 | #51 | Exceptional 64.3% |
| Immigrants | Netherlands | 99.8 /100 | #52 | Exceptional 64.2% |
| Asians | 99.8 /100 | #53 | Exceptional 64.2% |
Demographics Similar to Mexicans by College, 1 year or more
In terms of college, 1 year or more, the demographic groups most similar to Mexicans are Immigrants from Dominican Republic (49.1%, a difference of 0.17%), Lumbee (48.9%, a difference of 0.75%), Yuman (48.7%, a difference of 1.0%), Spanish American Indian (48.5%, a difference of 1.5%), and Pennsylvania German (48.5%, a difference of 1.5%).
| Demographics | Rating | Rank | College, 1 year or more |
| Immigrants | Latin America | 0.0 /100 | #325 | Tragic 50.7% |
| Dominicans | 0.0 /100 | #326 | Tragic 50.6% |
| Menominee | 0.0 /100 | #327 | Tragic 50.6% |
| Dutch West Indians | 0.0 /100 | #328 | Tragic 50.5% |
| Cape Verdeans | 0.0 /100 | #329 | Tragic 50.3% |
| Natives/Alaskans | 0.0 /100 | #330 | Tragic 50.2% |
| Immigrants | Yemen | 0.0 /100 | #331 | Tragic 50.0% |
| Mexicans | 0.0 /100 | #332 | Tragic 49.2% |
| Immigrants | Dominican Republic | 0.0 /100 | #333 | Tragic 49.1% |
| Lumbee | 0.0 /100 | #334 | Tragic 48.9% |
| Yuman | 0.0 /100 | #335 | Tragic 48.7% |
| Spanish American Indians | 0.0 /100 | #336 | Tragic 48.5% |
| Pennsylvania Germans | 0.0 /100 | #337 | Tragic 48.5% |
| Immigrants | Central America | 0.0 /100 | #338 | Tragic 48.5% |
| Immigrants | Azores | 0.0 /100 | #339 | Tragic 48.4% |