Paiute vs Houma College, 1 year or more
COMPARE
Paiute
Houma
College, 1 year or more
College, 1 year or more Comparison
Paiute
Houma
52.9%
COLLEGE, 1 YEAR OR MORE
0.0/ 100
METRIC RATING
297th/ 347
METRIC RANK
41.2%
COLLEGE, 1 YEAR OR MORE
0.0/ 100
METRIC RATING
346th/ 347
METRIC RANK
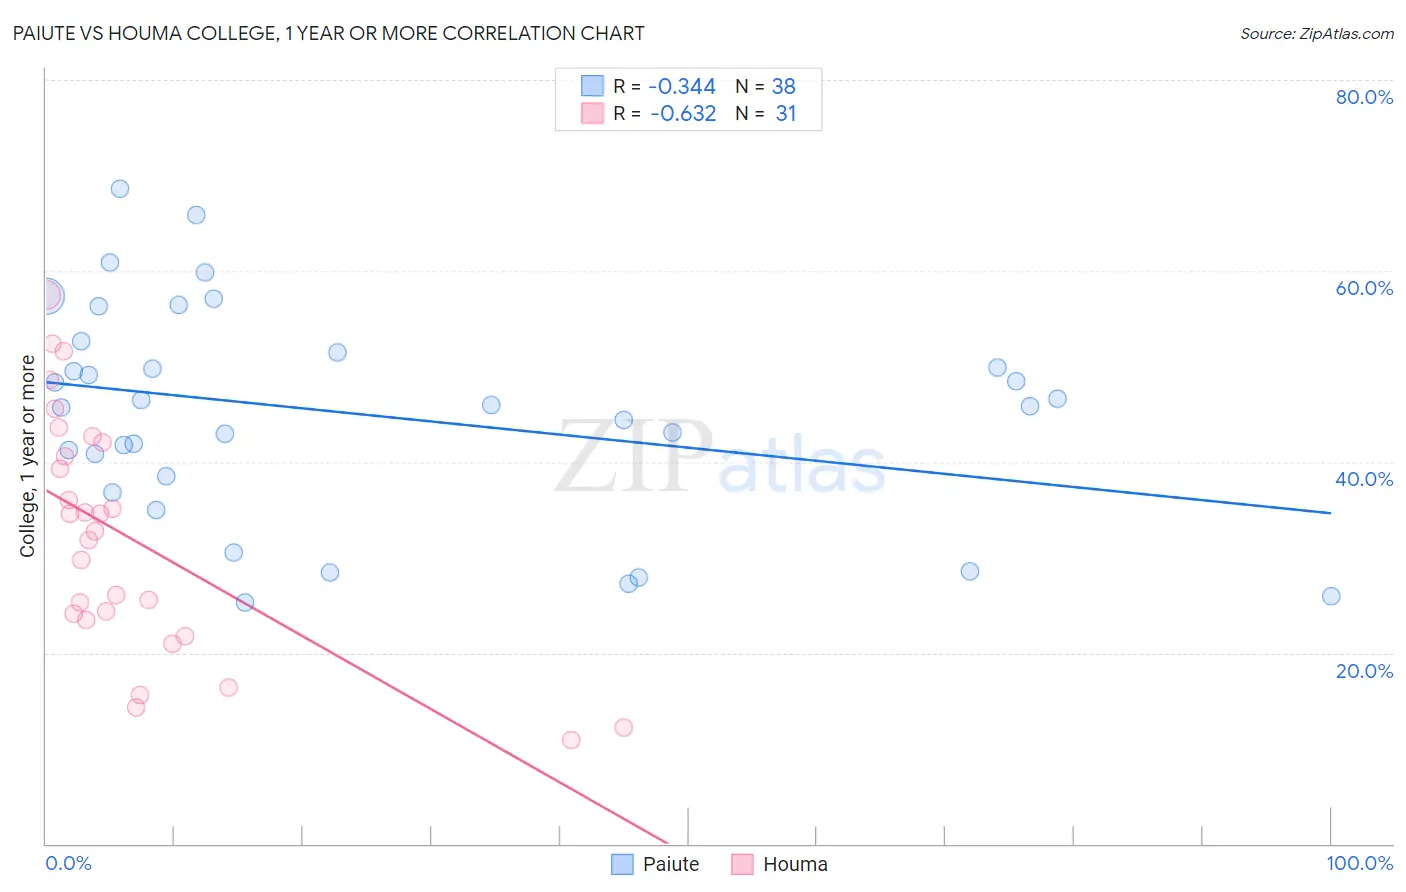
Paiute vs Houma College, 1 year or more Correlation Chart
The statistical analysis conducted on geographies consisting of 58,404,248 people shows a mild negative correlation between the proportion of Paiute and percentage of population with at least college, 1 year or more education in the United States with a correlation coefficient (R) of -0.344 and weighted average of 52.9%. Similarly, the statistical analysis conducted on geographies consisting of 36,795,542 people shows a significant negative correlation between the proportion of Houma and percentage of population with at least college, 1 year or more education in the United States with a correlation coefficient (R) of -0.632 and weighted average of 41.2%, a difference of 28.3%.
College, 1 year or more Correlation Summary
| Measurement | Paiute | Houma |
| Minimum | 25.3% | 10.8% |
| Maximum | 68.6% | 57.5% |
| Range | 43.4% | 46.7% |
| Mean | 45.0% | 32.1% |
| Median | 45.9% | 32.7% |
| Interquartile 25% (IQ1) | 38.5% | 23.5% |
| Interquartile 75% (IQ3) | 51.5% | 42.0% |
| Interquartile Range (IQR) | 13.0% | 18.6% |
| Standard Deviation (Sample) | 11.2% | 12.4% |
| Standard Deviation (Population) | 11.0% | 12.2% |
Similar Demographics by College, 1 year or more
Demographics Similar to Paiute by College, 1 year or more
In terms of college, 1 year or more, the demographic groups most similar to Paiute are Sioux (53.0%, a difference of 0.28%), Immigrants from Dominica (52.5%, a difference of 0.59%), Yaqui (53.2%, a difference of 0.62%), Cherokee (53.2%, a difference of 0.63%), and Black/African American (53.3%, a difference of 0.84%).
| Demographics | Rating | Rank | College, 1 year or more |
| Alaskan Athabascans | 0.0 /100 | #290 | Tragic 53.4% |
| Cubans | 0.0 /100 | #291 | Tragic 53.4% |
| Chickasaw | 0.0 /100 | #292 | Tragic 53.3% |
| Blacks/African Americans | 0.0 /100 | #293 | Tragic 53.3% |
| Cherokee | 0.0 /100 | #294 | Tragic 53.2% |
| Yaqui | 0.0 /100 | #295 | Tragic 53.2% |
| Sioux | 0.0 /100 | #296 | Tragic 53.0% |
| Paiute | 0.0 /100 | #297 | Tragic 52.9% |
| Immigrants | Dominica | 0.0 /100 | #298 | Tragic 52.5% |
| Immigrants | Nicaragua | 0.0 /100 | #299 | Tragic 52.4% |
| Choctaw | 0.0 /100 | #300 | Tragic 52.3% |
| Haitians | 0.0 /100 | #301 | Tragic 52.3% |
| Puerto Ricans | 0.0 /100 | #302 | Tragic 52.2% |
| Creek | 0.0 /100 | #303 | Tragic 52.2% |
| Central Americans | 0.0 /100 | #304 | Tragic 52.1% |
Demographics Similar to Houma by College, 1 year or more
In terms of college, 1 year or more, the demographic groups most similar to Houma are Yup'ik (39.4%, a difference of 4.5%), Pima (45.6%, a difference of 10.7%), Yakama (46.2%, a difference of 12.2%), Tohono O'odham (47.1%, a difference of 14.4%), and Inupiat (47.2%, a difference of 14.6%).
| Demographics | Rating | Rank | College, 1 year or more |
| Immigrants | Dominican Republic | 0.0 /100 | #333 | Tragic 49.1% |
| Lumbee | 0.0 /100 | #334 | Tragic 48.9% |
| Yuman | 0.0 /100 | #335 | Tragic 48.7% |
| Spanish American Indians | 0.0 /100 | #336 | Tragic 48.5% |
| Pennsylvania Germans | 0.0 /100 | #337 | Tragic 48.5% |
| Immigrants | Central America | 0.0 /100 | #338 | Tragic 48.5% |
| Immigrants | Azores | 0.0 /100 | #339 | Tragic 48.4% |
| Immigrants | Cabo Verde | 0.0 /100 | #340 | Tragic 48.1% |
| Immigrants | Mexico | 0.0 /100 | #341 | Tragic 47.5% |
| Inupiat | 0.0 /100 | #342 | Tragic 47.2% |
| Tohono O'odham | 0.0 /100 | #343 | Tragic 47.1% |
| Yakama | 0.0 /100 | #344 | Tragic 46.2% |
| Pima | 0.0 /100 | #345 | Tragic 45.6% |
| Houma | 0.0 /100 | #346 | Tragic 41.2% |
| Yup'ik | 0.0 /100 | #347 | Tragic 39.4% |