Comanche vs Immigrants from Germany College, Under 1 year
COMPARE
Comanche
Immigrants from Germany
College, Under 1 year
College, Under 1 year Comparison
Comanche
Immigrants from Germany
61.4%
COLLEGE, UNDER 1 YEAR
0.4/ 100
METRIC RATING
255th/ 347
METRIC RANK
66.5%
COLLEGE, UNDER 1 YEAR
82.0/ 100
METRIC RATING
144th/ 347
METRIC RANK
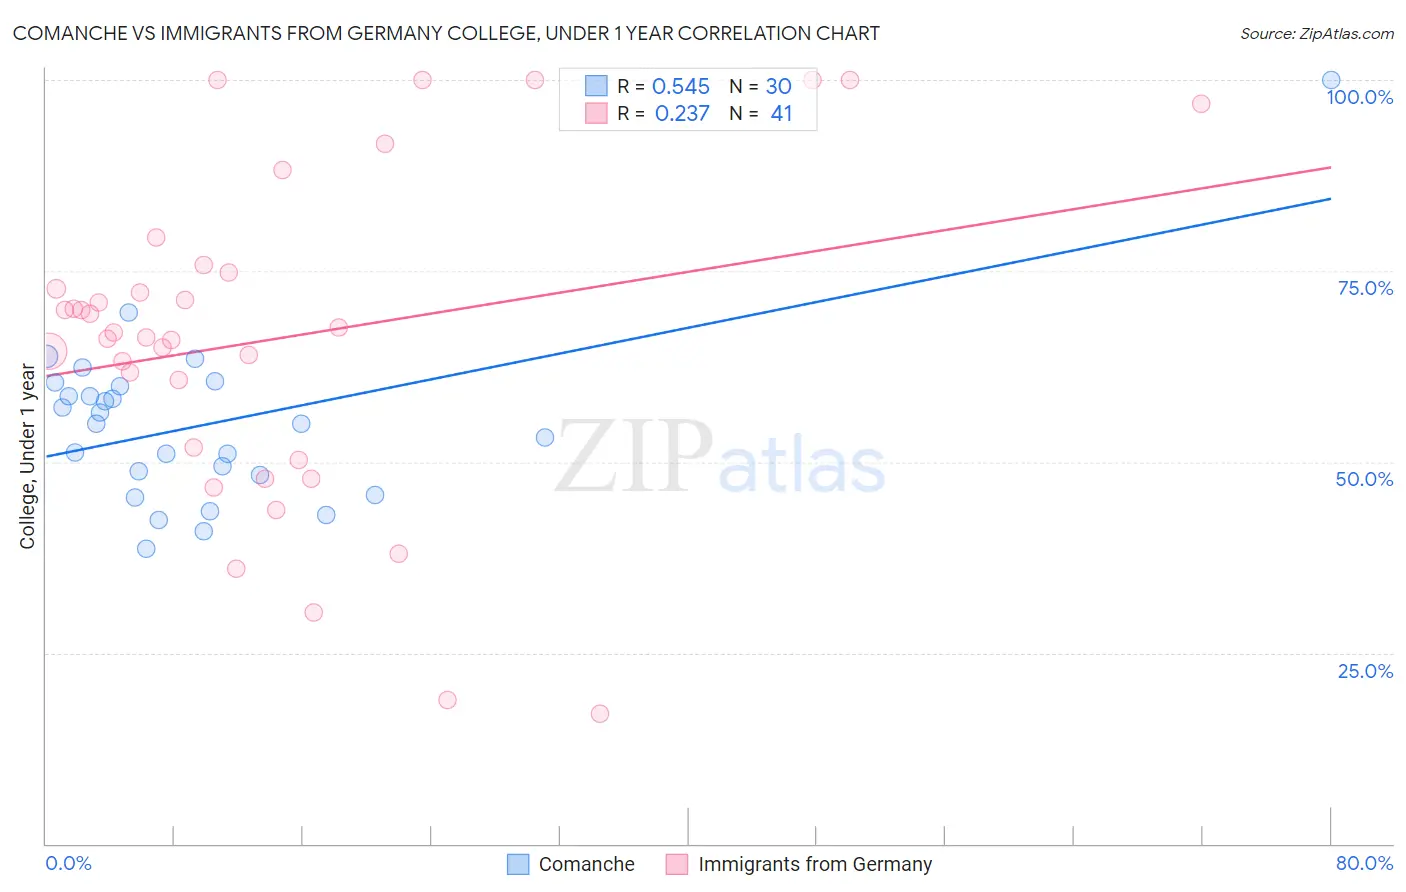
Comanche vs Immigrants from Germany College, Under 1 year Correlation Chart
The statistical analysis conducted on geographies consisting of 109,786,512 people shows a substantial positive correlation between the proportion of Comanche and percentage of population with at least college, under 1 year education in the United States with a correlation coefficient (R) of 0.545 and weighted average of 61.4%. Similarly, the statistical analysis conducted on geographies consisting of 463,885,143 people shows a weak positive correlation between the proportion of Immigrants from Germany and percentage of population with at least college, under 1 year education in the United States with a correlation coefficient (R) of 0.237 and weighted average of 66.5%, a difference of 8.3%.
College, Under 1 year Correlation Summary
| Measurement | Comanche | Immigrants from Germany |
| Minimum | 38.6% | 17.0% |
| Maximum | 100.0% | 100.0% |
| Range | 61.4% | 83.0% |
| Mean | 55.0% | 66.2% |
| Median | 54.9% | 66.9% |
| Interquartile 25% (IQ1) | 48.4% | 51.1% |
| Interquartile 75% (IQ3) | 60.0% | 75.3% |
| Interquartile Range (IQR) | 11.6% | 24.2% |
| Standard Deviation (Sample) | 11.5% | 21.2% |
| Standard Deviation (Population) | 11.3% | 21.0% |
Similar Demographics by College, Under 1 year
Demographics Similar to Comanche by College, Under 1 year
In terms of college, under 1 year, the demographic groups most similar to Comanche are Bangladeshi (61.4%, a difference of 0.040%), Immigrants from Cambodia (61.5%, a difference of 0.12%), West Indian (61.5%, a difference of 0.13%), Japanese (61.5%, a difference of 0.13%), and Immigrants from Laos (61.3%, a difference of 0.16%).
| Demographics | Rating | Rank | College, Under 1 year |
| Potawatomi | 0.6 /100 | #248 | Tragic 61.8% |
| Vietnamese | 0.5 /100 | #249 | Tragic 61.7% |
| Immigrants | Congo | 0.5 /100 | #250 | Tragic 61.7% |
| Immigrants | Micronesia | 0.5 /100 | #251 | Tragic 61.5% |
| West Indians | 0.4 /100 | #252 | Tragic 61.5% |
| Japanese | 0.4 /100 | #253 | Tragic 61.5% |
| Immigrants | Cambodia | 0.4 /100 | #254 | Tragic 61.5% |
| Comanche | 0.4 /100 | #255 | Tragic 61.4% |
| Bangladeshis | 0.4 /100 | #256 | Tragic 61.4% |
| Immigrants | Laos | 0.3 /100 | #257 | Tragic 61.3% |
| Immigrants | Bangladesh | 0.3 /100 | #258 | Tragic 61.3% |
| Indonesians | 0.3 /100 | #259 | Tragic 61.2% |
| Blackfeet | 0.3 /100 | #260 | Tragic 61.1% |
| Africans | 0.3 /100 | #261 | Tragic 61.1% |
| Barbadians | 0.2 /100 | #262 | Tragic 61.1% |
Demographics Similar to Immigrants from Germany by College, Under 1 year
In terms of college, under 1 year, the demographic groups most similar to Immigrants from Germany are Immigrants from Kenya (66.5%, a difference of 0.010%), Kenyan (66.5%, a difference of 0.020%), Immigrants from Morocco (66.5%, a difference of 0.020%), Immigrants from Uganda (66.5%, a difference of 0.060%), and English (66.6%, a difference of 0.070%).
| Demographics | Rating | Rank | College, Under 1 year |
| Immigrants | Chile | 87.4 /100 | #137 | Excellent 66.8% |
| Immigrants | Italy | 86.9 /100 | #138 | Excellent 66.8% |
| Venezuelans | 85.9 /100 | #139 | Excellent 66.7% |
| Slavs | 85.9 /100 | #140 | Excellent 66.7% |
| Immigrants | Afghanistan | 85.1 /100 | #141 | Excellent 66.7% |
| English | 82.9 /100 | #142 | Excellent 66.6% |
| Immigrants | Uganda | 82.8 /100 | #143 | Excellent 66.5% |
| Immigrants | Germany | 82.0 /100 | #144 | Excellent 66.5% |
| Immigrants | Kenya | 81.8 /100 | #145 | Excellent 66.5% |
| Kenyans | 81.7 /100 | #146 | Excellent 66.5% |
| Immigrants | Morocco | 81.7 /100 | #147 | Excellent 66.5% |
| Taiwanese | 78.6 /100 | #148 | Good 66.4% |
| Immigrants | Venezuela | 77.9 /100 | #149 | Good 66.3% |
| Immigrants | Iraq | 77.1 /100 | #150 | Good 66.3% |
| Immigrants | Sudan | 76.0 /100 | #151 | Good 66.2% |