Comanche vs Immigrants from Ghana College, Under 1 year
COMPARE
Comanche
Immigrants from Ghana
College, Under 1 year
College, Under 1 year Comparison
Comanche
Immigrants from Ghana
61.4%
COLLEGE, UNDER 1 YEAR
0.4/ 100
METRIC RATING
255th/ 347
METRIC RANK
63.1%
COLLEGE, UNDER 1 YEAR
3.7/ 100
METRIC RATING
227th/ 347
METRIC RANK
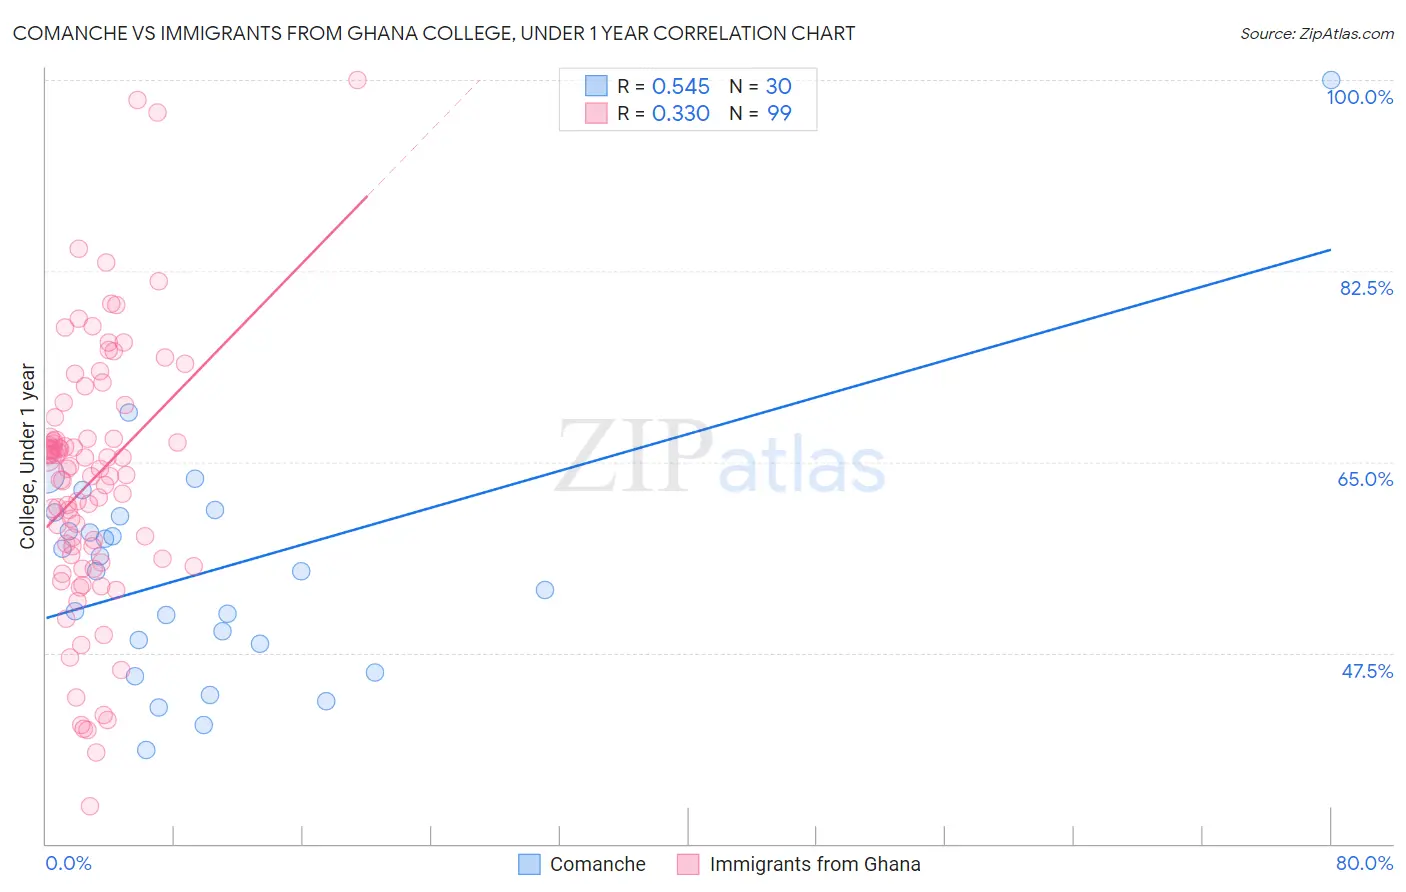
Comanche vs Immigrants from Ghana College, Under 1 year Correlation Chart
The statistical analysis conducted on geographies consisting of 109,786,512 people shows a substantial positive correlation between the proportion of Comanche and percentage of population with at least college, under 1 year education in the United States with a correlation coefficient (R) of 0.545 and weighted average of 61.4%. Similarly, the statistical analysis conducted on geographies consisting of 199,951,982 people shows a mild positive correlation between the proportion of Immigrants from Ghana and percentage of population with at least college, under 1 year education in the United States with a correlation coefficient (R) of 0.330 and weighted average of 63.1%, a difference of 2.7%.
College, Under 1 year Correlation Summary
| Measurement | Comanche | Immigrants from Ghana |
| Minimum | 38.6% | 33.5% |
| Maximum | 100.0% | 100.0% |
| Range | 61.4% | 66.5% |
| Mean | 55.0% | 63.3% |
| Median | 54.9% | 64.4% |
| Interquartile 25% (IQ1) | 48.4% | 56.1% |
| Interquartile 75% (IQ3) | 60.0% | 67.3% |
| Interquartile Range (IQR) | 11.6% | 11.2% |
| Standard Deviation (Sample) | 11.5% | 12.1% |
| Standard Deviation (Population) | 11.3% | 12.1% |
Similar Demographics by College, Under 1 year
Demographics Similar to Comanche by College, Under 1 year
In terms of college, under 1 year, the demographic groups most similar to Comanche are Bangladeshi (61.4%, a difference of 0.040%), Immigrants from Cambodia (61.5%, a difference of 0.12%), West Indian (61.5%, a difference of 0.13%), Japanese (61.5%, a difference of 0.13%), and Immigrants from Laos (61.3%, a difference of 0.16%).
| Demographics | Rating | Rank | College, Under 1 year |
| Potawatomi | 0.6 /100 | #248 | Tragic 61.8% |
| Vietnamese | 0.5 /100 | #249 | Tragic 61.7% |
| Immigrants | Congo | 0.5 /100 | #250 | Tragic 61.7% |
| Immigrants | Micronesia | 0.5 /100 | #251 | Tragic 61.5% |
| West Indians | 0.4 /100 | #252 | Tragic 61.5% |
| Japanese | 0.4 /100 | #253 | Tragic 61.5% |
| Immigrants | Cambodia | 0.4 /100 | #254 | Tragic 61.5% |
| Comanche | 0.4 /100 | #255 | Tragic 61.4% |
| Bangladeshis | 0.4 /100 | #256 | Tragic 61.4% |
| Immigrants | Laos | 0.3 /100 | #257 | Tragic 61.3% |
| Immigrants | Bangladesh | 0.3 /100 | #258 | Tragic 61.3% |
| Indonesians | 0.3 /100 | #259 | Tragic 61.2% |
| Blackfeet | 0.3 /100 | #260 | Tragic 61.1% |
| Africans | 0.3 /100 | #261 | Tragic 61.1% |
| Barbadians | 0.2 /100 | #262 | Tragic 61.1% |
Demographics Similar to Immigrants from Ghana by College, Under 1 year
In terms of college, under 1 year, the demographic groups most similar to Immigrants from Ghana are Immigrants from Colombia (63.1%, a difference of 0.090%), Immigrants from Peru (63.1%, a difference of 0.11%), Samoan (63.0%, a difference of 0.11%), Liberian (63.0%, a difference of 0.17%), and Subsaharan African (63.2%, a difference of 0.21%).
| Demographics | Rating | Rank | College, Under 1 year |
| Portuguese | 5.6 /100 | #220 | Tragic 63.4% |
| Cree | 5.2 /100 | #221 | Tragic 63.3% |
| Immigrants | Senegal | 5.0 /100 | #222 | Tragic 63.3% |
| Immigrants | Costa Rica | 4.5 /100 | #223 | Tragic 63.2% |
| Sub-Saharan Africans | 4.4 /100 | #224 | Tragic 63.2% |
| Immigrants | Peru | 4.0 /100 | #225 | Tragic 63.1% |
| Immigrants | Colombia | 4.0 /100 | #226 | Tragic 63.1% |
| Immigrants | Ghana | 3.7 /100 | #227 | Tragic 63.1% |
| Samoans | 3.3 /100 | #228 | Tragic 63.0% |
| Liberians | 3.2 /100 | #229 | Tragic 63.0% |
| Immigrants | Nonimmigrants | 3.0 /100 | #230 | Tragic 62.9% |
| Immigrants | Western Africa | 2.4 /100 | #231 | Tragic 62.8% |
| Osage | 2.2 /100 | #232 | Tragic 62.7% |
| Iroquois | 2.0 /100 | #233 | Tragic 62.6% |
| Chippewa | 2.0 /100 | #234 | Tragic 62.6% |