Comanche vs American Per Capita Income
COMPARE
Comanche
American
Per Capita Income
Per Capita Income Comparison
Comanche
Americans
$38,088
PER CAPITA INCOME
0.2/ 100
METRIC RATING
277th/ 347
METRIC RANK
$39,039
PER CAPITA INCOME
0.6/ 100
METRIC RATING
264th/ 347
METRIC RANK
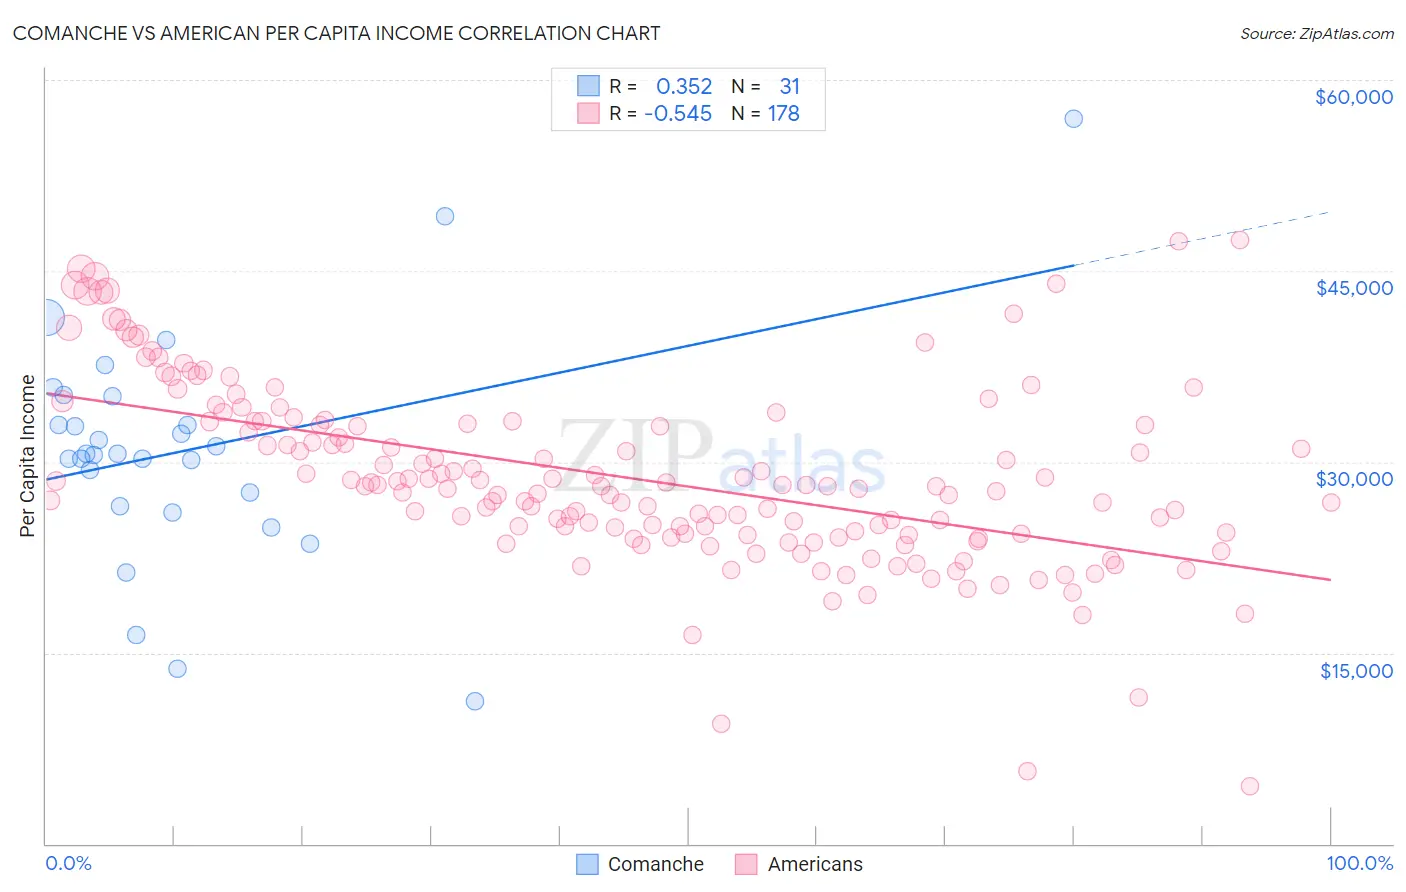
Comanche vs American Per Capita Income Correlation Chart
The statistical analysis conducted on geographies consisting of 109,786,530 people shows a mild positive correlation between the proportion of Comanche and per capita income in the United States with a correlation coefficient (R) of 0.352 and weighted average of $38,088. Similarly, the statistical analysis conducted on geographies consisting of 582,039,940 people shows a substantial negative correlation between the proportion of Americans and per capita income in the United States with a correlation coefficient (R) of -0.545 and weighted average of $39,039, a difference of 2.5%.
Per Capita Income Correlation Summary
| Measurement | Comanche | American |
| Minimum | $11,178 | $4,486 |
| Maximum | $56,980 | $47,414 |
| Range | $45,802 | $42,928 |
| Mean | $30,910 | $28,778 |
| Median | $30,680 | $28,107 |
| Interquartile 25% (IQ1) | $26,547 | $24,336 |
| Interquartile 75% (IQ3) | $35,132 | $33,158 |
| Interquartile Range (IQR) | $8,585 | $8,822 |
| Standard Deviation (Sample) | $9,053 | $7,186 |
| Standard Deviation (Population) | $8,906 | $7,166 |
Demographics Similar to Comanche and Americans by Per Capita Income
In terms of per capita income, the demographic groups most similar to Comanche are Immigrants from Nicaragua ($38,065, a difference of 0.060%), Hmong ($38,120, a difference of 0.080%), Colville ($38,047, a difference of 0.11%), Potawatomi ($38,046, a difference of 0.11%), and Immigrants from Liberia ($38,165, a difference of 0.20%). Similarly, the demographic groups most similar to Americans are Spanish American ($39,012, a difference of 0.070%), Belizean ($39,097, a difference of 0.15%), Iroquois ($39,104, a difference of 0.16%), Marshallese ($39,108, a difference of 0.17%), and Alaskan Athabascan ($39,163, a difference of 0.32%).
| Demographics | Rating | Rank | Per Capita Income |
| Alaskan Athabascans | 0.6 /100 | #260 | Tragic $39,163 |
| Marshallese | 0.6 /100 | #261 | Tragic $39,108 |
| Iroquois | 0.6 /100 | #262 | Tragic $39,104 |
| Belizeans | 0.6 /100 | #263 | Tragic $39,097 |
| Americans | 0.6 /100 | #264 | Tragic $39,039 |
| Spanish Americans | 0.5 /100 | #265 | Tragic $39,012 |
| Salvadorans | 0.5 /100 | #266 | Tragic $38,858 |
| Immigrants | Zaire | 0.4 /100 | #267 | Tragic $38,848 |
| Liberians | 0.4 /100 | #268 | Tragic $38,780 |
| Immigrants | Jamaica | 0.4 /100 | #269 | Tragic $38,766 |
| Immigrants | Belize | 0.3 /100 | #270 | Tragic $38,614 |
| Central Americans | 0.3 /100 | #271 | Tragic $38,560 |
| Immigrants | Cabo Verde | 0.3 /100 | #272 | Tragic $38,540 |
| Nepalese | 0.3 /100 | #273 | Tragic $38,442 |
| Immigrants | El Salvador | 0.3 /100 | #274 | Tragic $38,394 |
| Immigrants | Liberia | 0.2 /100 | #275 | Tragic $38,165 |
| Hmong | 0.2 /100 | #276 | Tragic $38,120 |
| Comanche | 0.2 /100 | #277 | Tragic $38,088 |
| Immigrants | Nicaragua | 0.2 /100 | #278 | Tragic $38,065 |
| Colville | 0.2 /100 | #279 | Tragic $38,047 |
| Potawatomi | 0.2 /100 | #280 | Tragic $38,046 |