Immigrants from Nepal vs American College, 1 year or more
COMPARE
Immigrants from Nepal
American
College, 1 year or more
College, 1 year or more Comparison
Immigrants from Nepal
Americans
62.0%
COLLEGE, 1 YEAR OR MORE
96.3/ 100
METRIC RATING
105th/ 347
METRIC RANK
54.4%
COLLEGE, 1 YEAR OR MORE
0.2/ 100
METRIC RATING
275th/ 347
METRIC RANK
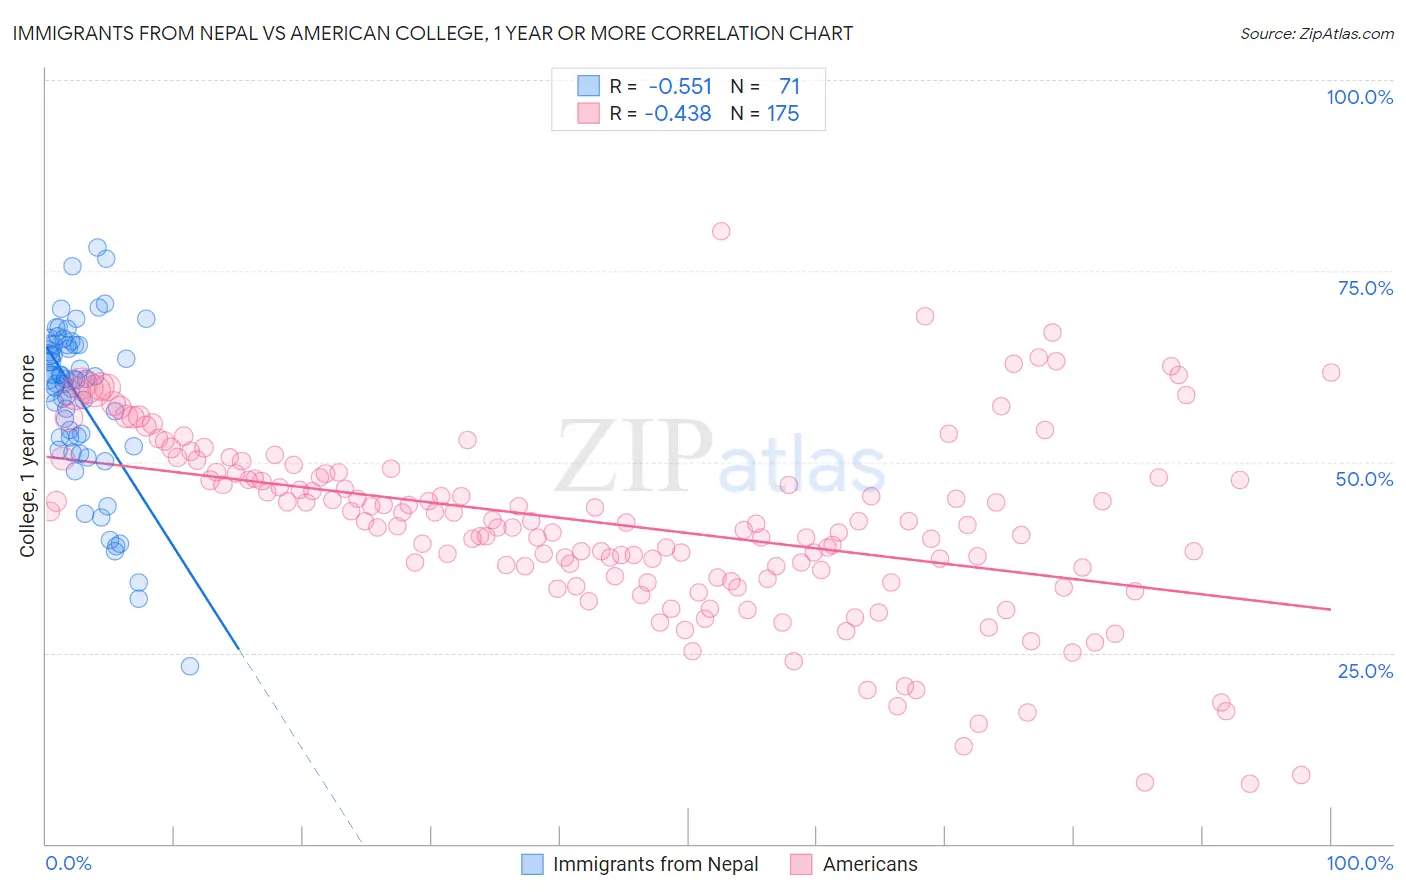
Immigrants from Nepal vs American College, 1 year or more Correlation Chart
The statistical analysis conducted on geographies consisting of 186,770,697 people shows a substantial negative correlation between the proportion of Immigrants from Nepal and percentage of population with at least college, 1 year or more education in the United States with a correlation coefficient (R) of -0.551 and weighted average of 62.0%. Similarly, the statistical analysis conducted on geographies consisting of 581,967,268 people shows a moderate negative correlation between the proportion of Americans and percentage of population with at least college, 1 year or more education in the United States with a correlation coefficient (R) of -0.438 and weighted average of 54.4%, a difference of 14.0%.
College, 1 year or more Correlation Summary
| Measurement | Immigrants from Nepal | American |
| Minimum | 23.3% | 7.8% |
| Maximum | 78.1% | 80.1% |
| Range | 54.8% | 72.3% |
| Mean | 58.2% | 41.8% |
| Median | 60.8% | 42.0% |
| Interquartile 25% (IQ1) | 53.2% | 35.0% |
| Interquartile 75% (IQ3) | 65.3% | 48.5% |
| Interquartile Range (IQR) | 12.1% | 13.6% |
| Standard Deviation (Sample) | 10.6% | 12.1% |
| Standard Deviation (Population) | 10.6% | 12.0% |
Similar Demographics by College, 1 year or more
Demographics Similar to Immigrants from Nepal by College, 1 year or more
In terms of college, 1 year or more, the demographic groups most similar to Immigrants from Nepal are Palestinian (62.0%, a difference of 0.0%), Chilean (62.0%, a difference of 0.020%), Afghan (62.0%, a difference of 0.030%), Luxembourger (62.1%, a difference of 0.15%), and Swedish (62.1%, a difference of 0.16%).
| Demographics | Rating | Rank | College, 1 year or more |
| Carpatho Rusyns | 97.2 /100 | #98 | Exceptional 62.2% |
| Croatians | 97.1 /100 | #99 | Exceptional 62.2% |
| Icelanders | 96.8 /100 | #100 | Exceptional 62.1% |
| Swedes | 96.8 /100 | #101 | Exceptional 62.1% |
| Luxembourgers | 96.7 /100 | #102 | Exceptional 62.1% |
| Afghans | 96.4 /100 | #103 | Exceptional 62.0% |
| Chileans | 96.4 /100 | #104 | Exceptional 62.0% |
| Immigrants | Nepal | 96.3 /100 | #105 | Exceptional 62.0% |
| Palestinians | 96.3 /100 | #106 | Exceptional 62.0% |
| Immigrants | Ukraine | 95.8 /100 | #107 | Exceptional 61.9% |
| Syrians | 95.7 /100 | #108 | Exceptional 61.9% |
| Immigrants | Northern Africa | 95.7 /100 | #109 | Exceptional 61.9% |
| Europeans | 95.6 /100 | #110 | Exceptional 61.8% |
| Macedonians | 95.6 /100 | #111 | Exceptional 61.8% |
| Austrians | 95.4 /100 | #112 | Exceptional 61.8% |
Demographics Similar to Americans by College, 1 year or more
In terms of college, 1 year or more, the demographic groups most similar to Americans are Belizean (54.4%, a difference of 0.020%), Immigrants from Grenada (54.4%, a difference of 0.060%), Shoshone (54.3%, a difference of 0.080%), Comanche (54.4%, a difference of 0.10%), and Ecuadorian (54.3%, a difference of 0.12%).
| Demographics | Rating | Rank | College, 1 year or more |
| British West Indians | 0.2 /100 | #268 | Tragic 54.5% |
| Bangladeshis | 0.2 /100 | #269 | Tragic 54.5% |
| Crow | 0.2 /100 | #270 | Tragic 54.5% |
| Bahamians | 0.2 /100 | #271 | Tragic 54.5% |
| Comanche | 0.2 /100 | #272 | Tragic 54.4% |
| Immigrants | Grenada | 0.2 /100 | #273 | Tragic 54.4% |
| Belizeans | 0.2 /100 | #274 | Tragic 54.4% |
| Americans | 0.2 /100 | #275 | Tragic 54.4% |
| Shoshone | 0.2 /100 | #276 | Tragic 54.3% |
| Ecuadorians | 0.2 /100 | #277 | Tragic 54.3% |
| Immigrants | Jamaica | 0.1 /100 | #278 | Tragic 54.2% |
| Arapaho | 0.1 /100 | #279 | Tragic 54.1% |
| Cheyenne | 0.1 /100 | #280 | Tragic 54.1% |
| Colville | 0.1 /100 | #281 | Tragic 54.1% |
| Guyanese | 0.1 /100 | #282 | Tragic 54.1% |