Immigrants from Latin America vs American College, 1 year or more
COMPARE
Immigrants from Latin America
American
College, 1 year or more
College, 1 year or more Comparison
Immigrants from Latin America
Americans
50.7%
COLLEGE, 1 YEAR OR MORE
0.0/ 100
METRIC RATING
325th/ 347
METRIC RANK
54.4%
COLLEGE, 1 YEAR OR MORE
0.2/ 100
METRIC RATING
275th/ 347
METRIC RANK
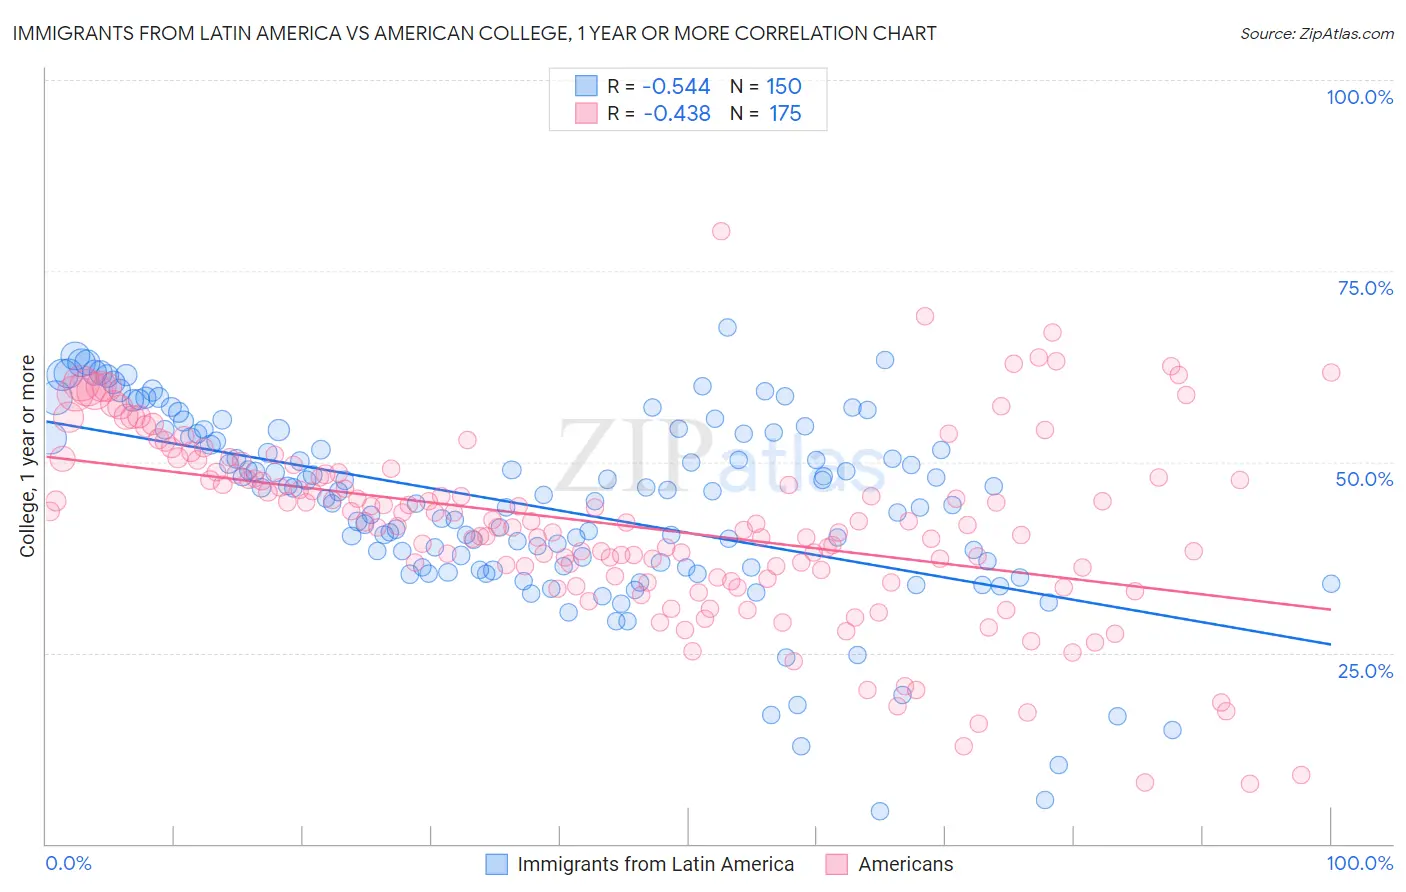
Immigrants from Latin America vs American College, 1 year or more Correlation Chart
The statistical analysis conducted on geographies consisting of 558,635,487 people shows a substantial negative correlation between the proportion of Immigrants from Latin America and percentage of population with at least college, 1 year or more education in the United States with a correlation coefficient (R) of -0.544 and weighted average of 50.7%. Similarly, the statistical analysis conducted on geographies consisting of 581,967,268 people shows a moderate negative correlation between the proportion of Americans and percentage of population with at least college, 1 year or more education in the United States with a correlation coefficient (R) of -0.438 and weighted average of 54.4%, a difference of 7.3%.
College, 1 year or more Correlation Summary
| Measurement | Immigrants from Latin America | American |
| Minimum | 4.2% | 7.8% |
| Maximum | 67.7% | 80.1% |
| Range | 63.5% | 72.3% |
| Mean | 44.2% | 41.8% |
| Median | 45.4% | 42.0% |
| Interquartile 25% (IQ1) | 36.2% | 35.0% |
| Interquartile 75% (IQ3) | 53.6% | 48.5% |
| Interquartile Range (IQR) | 17.4% | 13.6% |
| Standard Deviation (Sample) | 12.3% | 12.1% |
| Standard Deviation (Population) | 12.2% | 12.0% |
Similar Demographics by College, 1 year or more
Demographics Similar to Immigrants from Latin America by College, 1 year or more
In terms of college, 1 year or more, the demographic groups most similar to Immigrants from Latin America are Immigrants from Cuba (50.7%, a difference of 0.030%), Immigrants from Guatemala (50.7%, a difference of 0.040%), Dominican (50.6%, a difference of 0.18%), Menominee (50.6%, a difference of 0.22%), and Navajo (50.8%, a difference of 0.27%).
| Demographics | Rating | Rank | College, 1 year or more |
| Immigrants | Honduras | 0.0 /100 | #318 | Tragic 51.0% |
| Immigrants | El Salvador | 0.0 /100 | #319 | Tragic 51.0% |
| Kiowa | 0.0 /100 | #320 | Tragic 51.0% |
| Hopi | 0.0 /100 | #321 | Tragic 50.9% |
| Navajo | 0.0 /100 | #322 | Tragic 50.8% |
| Immigrants | Guatemala | 0.0 /100 | #323 | Tragic 50.7% |
| Immigrants | Cuba | 0.0 /100 | #324 | Tragic 50.7% |
| Immigrants | Latin America | 0.0 /100 | #325 | Tragic 50.7% |
| Dominicans | 0.0 /100 | #326 | Tragic 50.6% |
| Menominee | 0.0 /100 | #327 | Tragic 50.6% |
| Dutch West Indians | 0.0 /100 | #328 | Tragic 50.5% |
| Cape Verdeans | 0.0 /100 | #329 | Tragic 50.3% |
| Natives/Alaskans | 0.0 /100 | #330 | Tragic 50.2% |
| Immigrants | Yemen | 0.0 /100 | #331 | Tragic 50.0% |
| Mexicans | 0.0 /100 | #332 | Tragic 49.2% |
Demographics Similar to Americans by College, 1 year or more
In terms of college, 1 year or more, the demographic groups most similar to Americans are Belizean (54.4%, a difference of 0.020%), Immigrants from Grenada (54.4%, a difference of 0.060%), Shoshone (54.3%, a difference of 0.080%), Comanche (54.4%, a difference of 0.10%), and Ecuadorian (54.3%, a difference of 0.12%).
| Demographics | Rating | Rank | College, 1 year or more |
| British West Indians | 0.2 /100 | #268 | Tragic 54.5% |
| Bangladeshis | 0.2 /100 | #269 | Tragic 54.5% |
| Crow | 0.2 /100 | #270 | Tragic 54.5% |
| Bahamians | 0.2 /100 | #271 | Tragic 54.5% |
| Comanche | 0.2 /100 | #272 | Tragic 54.4% |
| Immigrants | Grenada | 0.2 /100 | #273 | Tragic 54.4% |
| Belizeans | 0.2 /100 | #274 | Tragic 54.4% |
| Americans | 0.2 /100 | #275 | Tragic 54.4% |
| Shoshone | 0.2 /100 | #276 | Tragic 54.3% |
| Ecuadorians | 0.2 /100 | #277 | Tragic 54.3% |
| Immigrants | Jamaica | 0.1 /100 | #278 | Tragic 54.2% |
| Arapaho | 0.1 /100 | #279 | Tragic 54.1% |
| Cheyenne | 0.1 /100 | #280 | Tragic 54.1% |
| Colville | 0.1 /100 | #281 | Tragic 54.1% |
| Guyanese | 0.1 /100 | #282 | Tragic 54.1% |