Chippewa vs Finnish No Schooling Completed
COMPARE
Chippewa
Finnish
No Schooling Completed
No Schooling Completed Comparison
Chippewa
Finns
1.6%
NO SCHOOLING COMPLETED
99.8/ 100
METRIC RATING
51st/ 347
METRIC RANK
1.5%
NO SCHOOLING COMPLETED
100.0/ 100
METRIC RATING
16th/ 347
METRIC RANK
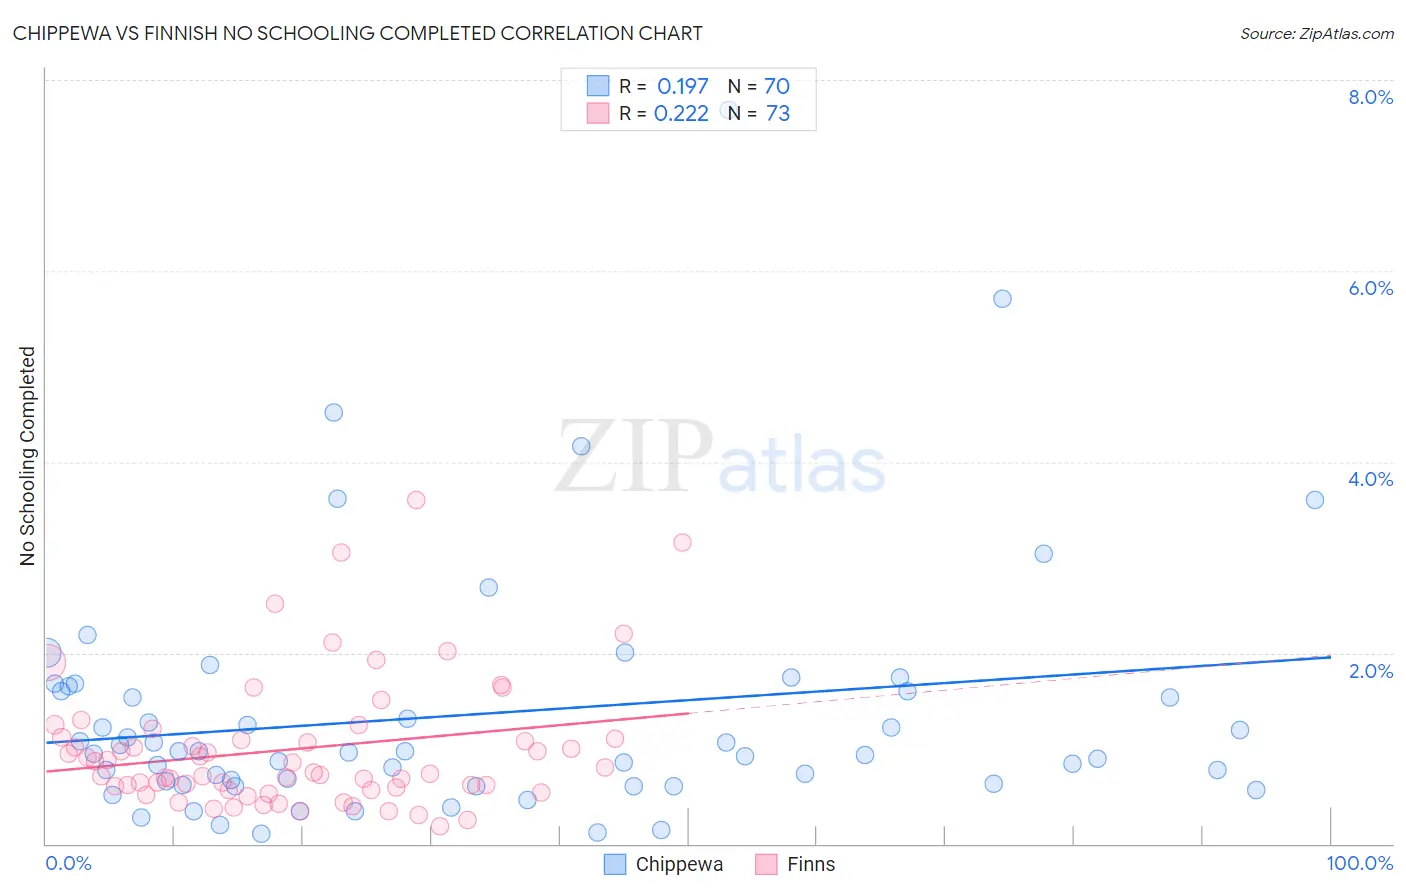
Chippewa vs Finnish No Schooling Completed Correlation Chart
The statistical analysis conducted on geographies consisting of 212,932,058 people shows a poor positive correlation between the proportion of Chippewa and percentage of population with no schooling in the United States with a correlation coefficient (R) of 0.197 and weighted average of 1.6%. Similarly, the statistical analysis conducted on geographies consisting of 398,073,835 people shows a weak positive correlation between the proportion of Finns and percentage of population with no schooling in the United States with a correlation coefficient (R) of 0.222 and weighted average of 1.5%, a difference of 12.1%.
No Schooling Completed Correlation Summary
| Measurement | Chippewa | Finnish |
| Minimum | 0.10% | 0.18% |
| Maximum | 7.7% | 3.6% |
| Range | 7.6% | 3.4% |
| Mean | 1.4% | 0.99% |
| Median | 0.96% | 0.75% |
| Interquartile 25% (IQ1) | 0.63% | 0.58% |
| Interquartile 75% (IQ3) | 1.6% | 1.1% |
| Interquartile Range (IQR) | 0.96% | 0.53% |
| Standard Deviation (Sample) | 1.3% | 0.68% |
| Standard Deviation (Population) | 1.3% | 0.68% |
Similar Demographics by No Schooling Completed
Demographics Similar to Chippewa by No Schooling Completed
In terms of no schooling completed, the demographic groups most similar to Chippewa are Immigrants from Canada (1.6%, a difference of 0.070%), Celtic (1.6%, a difference of 0.20%), Creek (1.6%, a difference of 0.20%), Crow (1.6%, a difference of 0.23%), and White/Caucasian (1.6%, a difference of 0.34%).
| Demographics | Rating | Rank | No Schooling Completed |
| Estonians | 99.9 /100 | #44 | Exceptional 1.6% |
| Czechoslovakians | 99.9 /100 | #45 | Exceptional 1.6% |
| Maltese | 99.9 /100 | #46 | Exceptional 1.6% |
| Ottawa | 99.9 /100 | #47 | Exceptional 1.6% |
| Immigrants | Scotland | 99.9 /100 | #48 | Exceptional 1.6% |
| Whites/Caucasians | 99.9 /100 | #49 | Exceptional 1.6% |
| Celtics | 99.9 /100 | #50 | Exceptional 1.6% |
| Chippewa | 99.8 /100 | #51 | Exceptional 1.6% |
| Immigrants | Canada | 99.8 /100 | #52 | Exceptional 1.6% |
| Creek | 99.8 /100 | #53 | Exceptional 1.6% |
| Crow | 99.8 /100 | #54 | Exceptional 1.6% |
| Greeks | 99.8 /100 | #55 | Exceptional 1.6% |
| Immigrants | North America | 99.8 /100 | #56 | Exceptional 1.6% |
| Austrians | 99.8 /100 | #57 | Exceptional 1.6% |
| Kiowa | 99.8 /100 | #58 | Exceptional 1.6% |
Demographics Similar to Finns by No Schooling Completed
In terms of no schooling completed, the demographic groups most similar to Finns are Croatian (1.5%, a difference of 0.010%), Danish (1.5%, a difference of 0.31%), Alaskan Athabascan (1.5%, a difference of 0.42%), Tlingit-Haida (1.5%, a difference of 0.52%), and Welsh (1.5%, a difference of 0.54%).
| Demographics | Rating | Rank | No Schooling Completed |
| Scottish | 100.0 /100 | #9 | Exceptional 1.4% |
| Dutch | 100.0 /100 | #10 | Exceptional 1.4% |
| Lithuanians | 100.0 /100 | #11 | Exceptional 1.4% |
| Irish | 100.0 /100 | #12 | Exceptional 1.4% |
| Poles | 100.0 /100 | #13 | Exceptional 1.4% |
| Scotch-Irish | 100.0 /100 | #14 | Exceptional 1.5% |
| Tlingit-Haida | 100.0 /100 | #15 | Exceptional 1.5% |
| Finns | 100.0 /100 | #16 | Exceptional 1.5% |
| Croatians | 100.0 /100 | #17 | Exceptional 1.5% |
| Danes | 100.0 /100 | #18 | Exceptional 1.5% |
| Alaskan Athabascans | 100.0 /100 | #19 | Exceptional 1.5% |
| Welsh | 100.0 /100 | #20 | Exceptional 1.5% |
| Chinese | 100.0 /100 | #21 | Exceptional 1.5% |
| Alaska Natives | 100.0 /100 | #22 | Exceptional 1.5% |
| Europeans | 100.0 /100 | #23 | Exceptional 1.5% |