Chippewa vs Bolivian No Schooling Completed
COMPARE
Chippewa
Bolivian
No Schooling Completed
No Schooling Completed Comparison
Chippewa
Bolivians
1.6%
NO SCHOOLING COMPLETED
99.8/ 100
METRIC RATING
51st/ 347
METRIC RANK
2.4%
NO SCHOOLING COMPLETED
1.4/ 100
METRIC RATING
245th/ 347
METRIC RANK
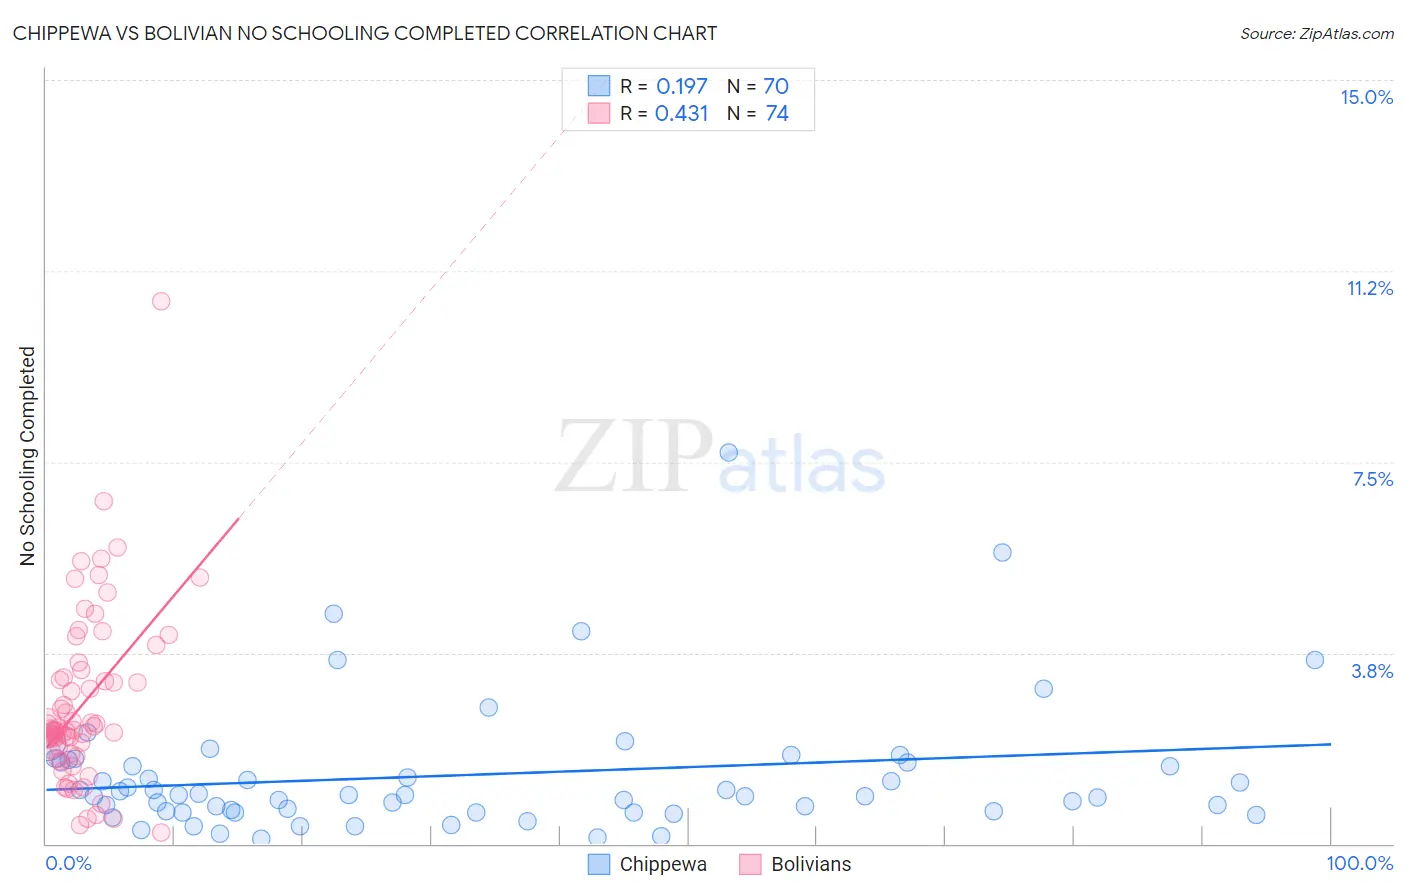
Chippewa vs Bolivian No Schooling Completed Correlation Chart
The statistical analysis conducted on geographies consisting of 212,932,058 people shows a poor positive correlation between the proportion of Chippewa and percentage of population with no schooling in the United States with a correlation coefficient (R) of 0.197 and weighted average of 1.6%. Similarly, the statistical analysis conducted on geographies consisting of 184,159,099 people shows a moderate positive correlation between the proportion of Bolivians and percentage of population with no schooling in the United States with a correlation coefficient (R) of 0.431 and weighted average of 2.4%, a difference of 46.0%.
No Schooling Completed Correlation Summary
| Measurement | Chippewa | Bolivian |
| Minimum | 0.10% | 0.23% |
| Maximum | 7.7% | 10.7% |
| Range | 7.6% | 10.4% |
| Mean | 1.4% | 2.7% |
| Median | 0.96% | 2.2% |
| Interquartile 25% (IQ1) | 0.63% | 1.8% |
| Interquartile 75% (IQ3) | 1.6% | 3.3% |
| Interquartile Range (IQR) | 0.96% | 1.4% |
| Standard Deviation (Sample) | 1.3% | 1.7% |
| Standard Deviation (Population) | 1.3% | 1.7% |
Similar Demographics by No Schooling Completed
Demographics Similar to Chippewa by No Schooling Completed
In terms of no schooling completed, the demographic groups most similar to Chippewa are Immigrants from Canada (1.6%, a difference of 0.070%), Celtic (1.6%, a difference of 0.20%), Creek (1.6%, a difference of 0.20%), Crow (1.6%, a difference of 0.23%), and White/Caucasian (1.6%, a difference of 0.34%).
| Demographics | Rating | Rank | No Schooling Completed |
| Estonians | 99.9 /100 | #44 | Exceptional 1.6% |
| Czechoslovakians | 99.9 /100 | #45 | Exceptional 1.6% |
| Maltese | 99.9 /100 | #46 | Exceptional 1.6% |
| Ottawa | 99.9 /100 | #47 | Exceptional 1.6% |
| Immigrants | Scotland | 99.9 /100 | #48 | Exceptional 1.6% |
| Whites/Caucasians | 99.9 /100 | #49 | Exceptional 1.6% |
| Celtics | 99.9 /100 | #50 | Exceptional 1.6% |
| Chippewa | 99.8 /100 | #51 | Exceptional 1.6% |
| Immigrants | Canada | 99.8 /100 | #52 | Exceptional 1.6% |
| Creek | 99.8 /100 | #53 | Exceptional 1.6% |
| Crow | 99.8 /100 | #54 | Exceptional 1.6% |
| Greeks | 99.8 /100 | #55 | Exceptional 1.6% |
| Immigrants | North America | 99.8 /100 | #56 | Exceptional 1.6% |
| Austrians | 99.8 /100 | #57 | Exceptional 1.6% |
| Kiowa | 99.8 /100 | #58 | Exceptional 1.6% |
Demographics Similar to Bolivians by No Schooling Completed
In terms of no schooling completed, the demographic groups most similar to Bolivians are Peruvian (2.4%, a difference of 0.010%), Immigrants from Congo (2.4%, a difference of 0.050%), South American (2.4%, a difference of 0.11%), Immigrants from Indonesia (2.4%, a difference of 0.15%), and Immigrants from Iraq (2.4%, a difference of 0.16%).
| Demographics | Rating | Rank | No Schooling Completed |
| Paiute | 1.9 /100 | #238 | Tragic 2.4% |
| Liberians | 1.8 /100 | #239 | Tragic 2.4% |
| Immigrants | Senegal | 1.7 /100 | #240 | Tragic 2.4% |
| Koreans | 1.7 /100 | #241 | Tragic 2.4% |
| Immigrants | Indonesia | 1.5 /100 | #242 | Tragic 2.4% |
| South Americans | 1.5 /100 | #243 | Tragic 2.4% |
| Peruvians | 1.4 /100 | #244 | Tragic 2.4% |
| Bolivians | 1.4 /100 | #245 | Tragic 2.4% |
| Immigrants | Congo | 1.4 /100 | #246 | Tragic 2.4% |
| Immigrants | Iraq | 1.3 /100 | #247 | Tragic 2.4% |
| Asians | 1.2 /100 | #248 | Tragic 2.4% |
| Jamaicans | 1.2 /100 | #249 | Tragic 2.4% |
| Immigrants | Middle Africa | 1.1 /100 | #250 | Tragic 2.4% |
| Immigrants | Africa | 1.1 /100 | #251 | Tragic 2.4% |
| Immigrants | Colombia | 1.0 /100 | #252 | Tragic 2.4% |