Chippewa vs Immigrants from Trinidad and Tobago No Schooling Completed
COMPARE
Chippewa
Immigrants from Trinidad and Tobago
No Schooling Completed
No Schooling Completed Comparison
Chippewa
Immigrants from Trinidad and Tobago
1.6%
NO SCHOOLING COMPLETED
99.8/ 100
METRIC RATING
51st/ 347
METRIC RANK
2.6%
NO SCHOOLING COMPLETED
0.0/ 100
METRIC RATING
283rd/ 347
METRIC RANK
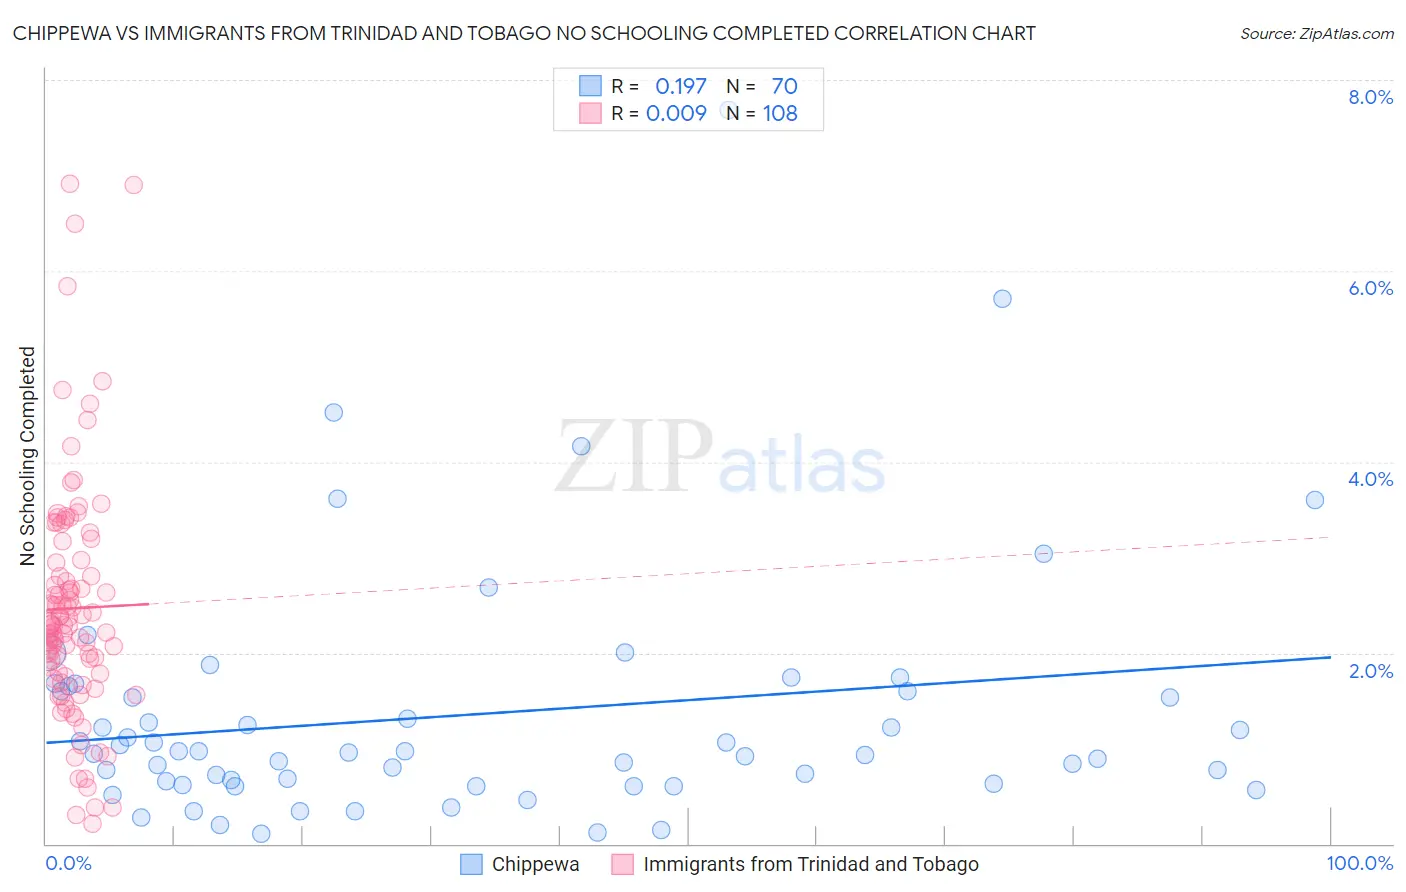
Chippewa vs Immigrants from Trinidad and Tobago No Schooling Completed Correlation Chart
The statistical analysis conducted on geographies consisting of 212,932,058 people shows a poor positive correlation between the proportion of Chippewa and percentage of population with no schooling in the United States with a correlation coefficient (R) of 0.197 and weighted average of 1.6%. Similarly, the statistical analysis conducted on geographies consisting of 222,835,417 people shows no correlation between the proportion of Immigrants from Trinidad and Tobago and percentage of population with no schooling in the United States with a correlation coefficient (R) of 0.009 and weighted average of 2.6%, a difference of 61.2%.
No Schooling Completed Correlation Summary
| Measurement | Chippewa | Immigrants from Trinidad and Tobago |
| Minimum | 0.10% | 0.21% |
| Maximum | 7.7% | 6.9% |
| Range | 7.6% | 6.7% |
| Mean | 1.4% | 2.5% |
| Median | 0.96% | 2.3% |
| Interquartile 25% (IQ1) | 0.63% | 1.8% |
| Interquartile 75% (IQ3) | 1.6% | 2.9% |
| Interquartile Range (IQR) | 0.96% | 1.1% |
| Standard Deviation (Sample) | 1.3% | 1.2% |
| Standard Deviation (Population) | 1.3% | 1.2% |
Similar Demographics by No Schooling Completed
Demographics Similar to Chippewa by No Schooling Completed
In terms of no schooling completed, the demographic groups most similar to Chippewa are Immigrants from Canada (1.6%, a difference of 0.070%), Celtic (1.6%, a difference of 0.20%), Creek (1.6%, a difference of 0.20%), Crow (1.6%, a difference of 0.23%), and White/Caucasian (1.6%, a difference of 0.34%).
| Demographics | Rating | Rank | No Schooling Completed |
| Estonians | 99.9 /100 | #44 | Exceptional 1.6% |
| Czechoslovakians | 99.9 /100 | #45 | Exceptional 1.6% |
| Maltese | 99.9 /100 | #46 | Exceptional 1.6% |
| Ottawa | 99.9 /100 | #47 | Exceptional 1.6% |
| Immigrants | Scotland | 99.9 /100 | #48 | Exceptional 1.6% |
| Whites/Caucasians | 99.9 /100 | #49 | Exceptional 1.6% |
| Celtics | 99.9 /100 | #50 | Exceptional 1.6% |
| Chippewa | 99.8 /100 | #51 | Exceptional 1.6% |
| Immigrants | Canada | 99.8 /100 | #52 | Exceptional 1.6% |
| Creek | 99.8 /100 | #53 | Exceptional 1.6% |
| Crow | 99.8 /100 | #54 | Exceptional 1.6% |
| Greeks | 99.8 /100 | #55 | Exceptional 1.6% |
| Immigrants | North America | 99.8 /100 | #56 | Exceptional 1.6% |
| Austrians | 99.8 /100 | #57 | Exceptional 1.6% |
| Kiowa | 99.8 /100 | #58 | Exceptional 1.6% |
Demographics Similar to Immigrants from Trinidad and Tobago by No Schooling Completed
In terms of no schooling completed, the demographic groups most similar to Immigrants from Trinidad and Tobago are Immigrants from West Indies (2.7%, a difference of 0.72%), Immigrants from Barbados (2.7%, a difference of 0.80%), Immigrants from Ghana (2.6%, a difference of 1.2%), Immigrants from Portugal (2.7%, a difference of 1.2%), and Afghan (2.6%, a difference of 1.4%).
| Demographics | Rating | Rank | No Schooling Completed |
| Immigrants | Western Africa | 0.1 /100 | #276 | Tragic 2.6% |
| Immigrants | Philippines | 0.1 /100 | #277 | Tragic 2.6% |
| Immigrants | Uzbekistan | 0.1 /100 | #278 | Tragic 2.6% |
| Barbadians | 0.1 /100 | #279 | Tragic 2.6% |
| Trinidadians and Tobagonians | 0.1 /100 | #280 | Tragic 2.6% |
| Afghans | 0.1 /100 | #281 | Tragic 2.6% |
| Immigrants | Ghana | 0.1 /100 | #282 | Tragic 2.6% |
| Immigrants | Trinidad and Tobago | 0.0 /100 | #283 | Tragic 2.6% |
| Immigrants | West Indies | 0.0 /100 | #284 | Tragic 2.7% |
| Immigrants | Barbados | 0.0 /100 | #285 | Tragic 2.7% |
| Immigrants | Portugal | 0.0 /100 | #286 | Tragic 2.7% |
| Immigrants | Afghanistan | 0.0 /100 | #287 | Tragic 2.7% |
| Immigrants | St. Vincent and the Grenadines | 0.0 /100 | #288 | Tragic 2.7% |
| Immigrants | Thailand | 0.0 /100 | #289 | Tragic 2.7% |
| Immigrants | Hong Kong | 0.0 /100 | #290 | Tragic 2.7% |