Chippewa vs Immigrants from Armenia Associate's Degree
COMPARE
Chippewa
Immigrants from Armenia
Associate's Degree
Associate's Degree Comparison
Chippewa
Immigrants from Armenia
40.7%
ASSOCIATE'S DEGREE
0.2/ 100
METRIC RATING
270th/ 347
METRIC RANK
47.4%
ASSOCIATE'S DEGREE
76.6/ 100
METRIC RATING
149th/ 347
METRIC RANK
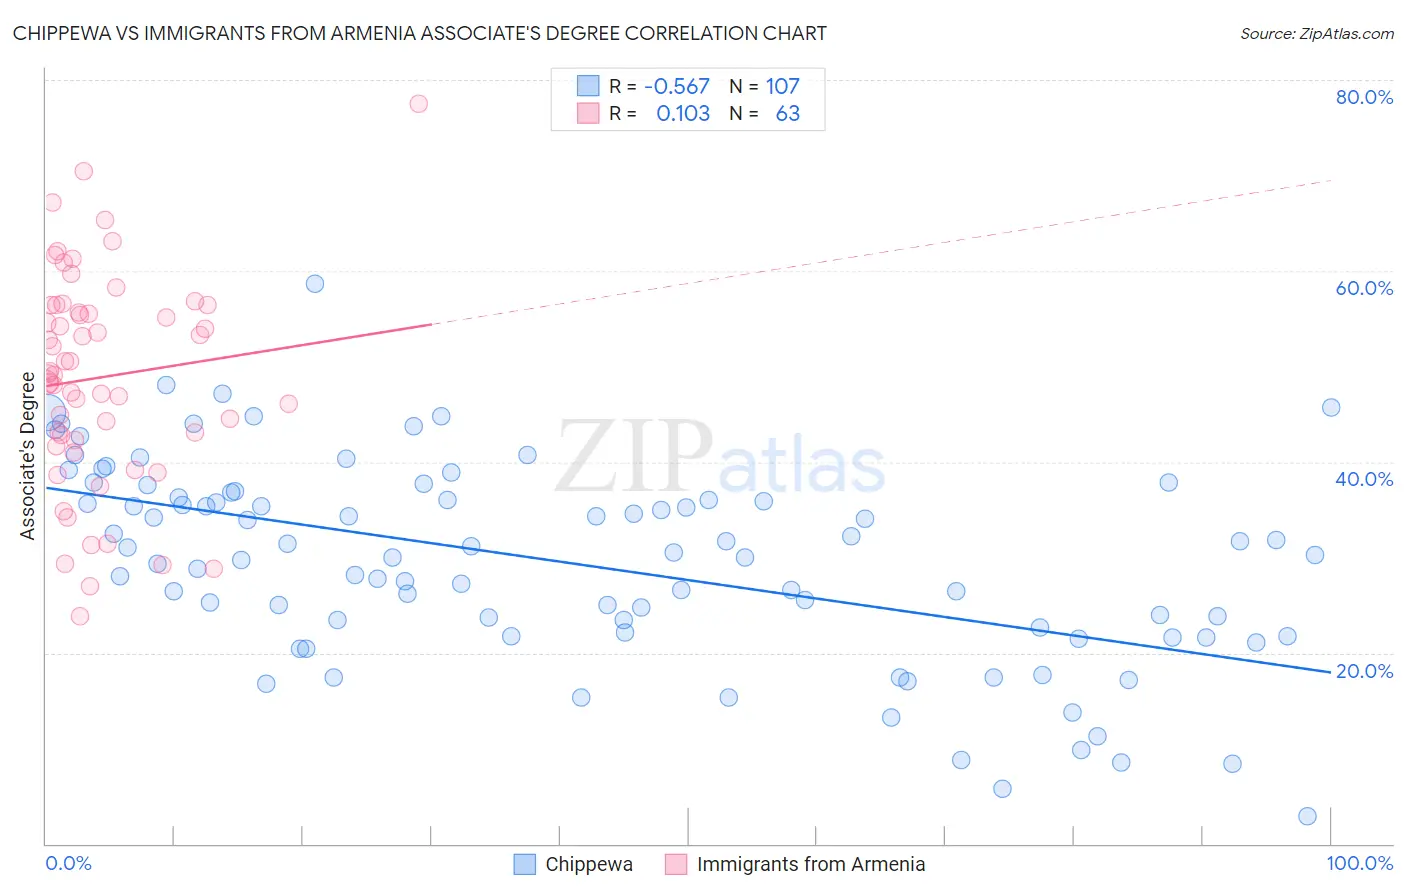
Chippewa vs Immigrants from Armenia Associate's Degree Correlation Chart
The statistical analysis conducted on geographies consisting of 215,061,498 people shows a substantial negative correlation between the proportion of Chippewa and percentage of population with at least associate's degree education in the United States with a correlation coefficient (R) of -0.567 and weighted average of 40.7%. Similarly, the statistical analysis conducted on geographies consisting of 97,722,982 people shows a poor positive correlation between the proportion of Immigrants from Armenia and percentage of population with at least associate's degree education in the United States with a correlation coefficient (R) of 0.103 and weighted average of 47.4%, a difference of 16.3%.
Associate's Degree Correlation Summary
| Measurement | Chippewa | Immigrants from Armenia |
| Minimum | 2.9% | 23.8% |
| Maximum | 58.7% | 77.6% |
| Range | 55.8% | 53.7% |
| Mean | 29.5% | 48.9% |
| Median | 30.2% | 49.2% |
| Interquartile 25% (IQ1) | 22.1% | 42.3% |
| Interquartile 75% (IQ3) | 36.2% | 56.4% |
| Interquartile Range (IQR) | 14.1% | 14.1% |
| Standard Deviation (Sample) | 10.5% | 11.1% |
| Standard Deviation (Population) | 10.4% | 11.0% |
Similar Demographics by Associate's Degree
Demographics Similar to Chippewa by Associate's Degree
In terms of associate's degree, the demographic groups most similar to Chippewa are American (40.8%, a difference of 0.050%), Immigrants from Laos (40.7%, a difference of 0.18%), Central American Indian (40.8%, a difference of 0.23%), Belizean (40.6%, a difference of 0.25%), and Hawaiian (40.9%, a difference of 0.42%).
| Demographics | Rating | Rank | Associate's Degree |
| Immigrants | Jamaica | 0.3 /100 | #263 | Tragic 41.5% |
| Osage | 0.3 /100 | #264 | Tragic 41.5% |
| Africans | 0.2 /100 | #265 | Tragic 41.1% |
| Samoans | 0.2 /100 | #266 | Tragic 41.1% |
| Hawaiians | 0.2 /100 | #267 | Tragic 40.9% |
| Central American Indians | 0.2 /100 | #268 | Tragic 40.8% |
| Americans | 0.2 /100 | #269 | Tragic 40.8% |
| Chippewa | 0.2 /100 | #270 | Tragic 40.7% |
| Immigrants | Laos | 0.1 /100 | #271 | Tragic 40.7% |
| Belizeans | 0.1 /100 | #272 | Tragic 40.6% |
| Puget Sound Salish | 0.1 /100 | #273 | Tragic 40.5% |
| Immigrants | Dominica | 0.1 /100 | #274 | Tragic 40.5% |
| Potawatomi | 0.1 /100 | #275 | Tragic 40.4% |
| Puerto Ricans | 0.1 /100 | #276 | Tragic 40.4% |
| Blackfeet | 0.1 /100 | #277 | Tragic 40.3% |
Demographics Similar to Immigrants from Armenia by Associate's Degree
In terms of associate's degree, the demographic groups most similar to Immigrants from Armenia are South American Indian (47.4%, a difference of 0.010%), Iraqi (47.4%, a difference of 0.040%), Immigrants from North Macedonia (47.4%, a difference of 0.060%), Danish (47.4%, a difference of 0.070%), and Immigrants from Sudan (47.4%, a difference of 0.13%).
| Demographics | Rating | Rank | Associate's Degree |
| Sierra Leoneans | 82.9 /100 | #142 | Excellent 47.7% |
| Norwegians | 81.0 /100 | #143 | Excellent 47.6% |
| Slavs | 80.5 /100 | #144 | Excellent 47.6% |
| Canadians | 79.0 /100 | #145 | Good 47.5% |
| Immigrants | Sudan | 77.9 /100 | #146 | Good 47.4% |
| Danes | 77.3 /100 | #147 | Good 47.4% |
| South American Indians | 76.7 /100 | #148 | Good 47.4% |
| Immigrants | Armenia | 76.6 /100 | #149 | Good 47.4% |
| Iraqis | 76.2 /100 | #150 | Good 47.4% |
| Immigrants | North Macedonia | 76.0 /100 | #151 | Good 47.4% |
| Immigrants | Afghanistan | 74.3 /100 | #152 | Good 47.3% |
| Czechs | 72.2 /100 | #153 | Good 47.2% |
| Immigrants | Kenya | 72.1 /100 | #154 | Good 47.2% |
| Kenyans | 70.6 /100 | #155 | Good 47.1% |
| South Americans | 70.5 /100 | #156 | Good 47.1% |