Chippewa vs Immigrants from Syria Associate's Degree
COMPARE
Chippewa
Immigrants from Syria
Associate's Degree
Associate's Degree Comparison
Chippewa
Immigrants from Syria
40.7%
ASSOCIATE'S DEGREE
0.2/ 100
METRIC RATING
270th/ 347
METRIC RANK
48.5%
ASSOCIATE'S DEGREE
92.2/ 100
METRIC RATING
126th/ 347
METRIC RANK
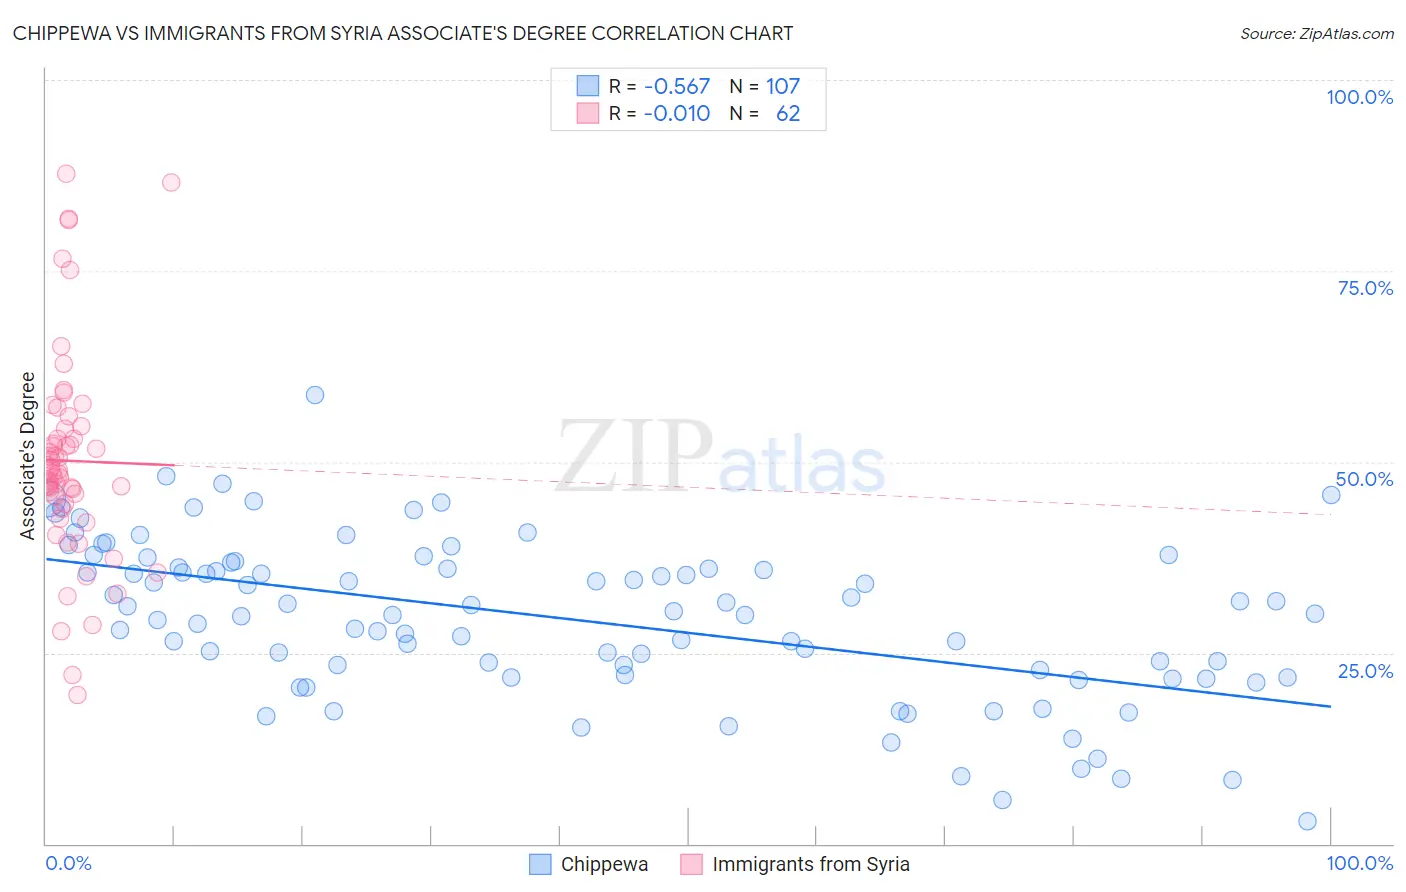
Chippewa vs Immigrants from Syria Associate's Degree Correlation Chart
The statistical analysis conducted on geographies consisting of 215,061,498 people shows a substantial negative correlation between the proportion of Chippewa and percentage of population with at least associate's degree education in the United States with a correlation coefficient (R) of -0.567 and weighted average of 40.7%. Similarly, the statistical analysis conducted on geographies consisting of 174,109,130 people shows no correlation between the proportion of Immigrants from Syria and percentage of population with at least associate's degree education in the United States with a correlation coefficient (R) of -0.010 and weighted average of 48.5%, a difference of 19.0%.
Associate's Degree Correlation Summary
| Measurement | Chippewa | Immigrants from Syria |
| Minimum | 2.9% | 19.4% |
| Maximum | 58.7% | 87.7% |
| Range | 55.8% | 68.3% |
| Mean | 29.5% | 50.1% |
| Median | 30.2% | 48.8% |
| Interquartile 25% (IQ1) | 22.1% | 44.5% |
| Interquartile 75% (IQ3) | 36.2% | 54.4% |
| Interquartile Range (IQR) | 14.1% | 9.9% |
| Standard Deviation (Sample) | 10.5% | 13.7% |
| Standard Deviation (Population) | 10.4% | 13.6% |
Similar Demographics by Associate's Degree
Demographics Similar to Chippewa by Associate's Degree
In terms of associate's degree, the demographic groups most similar to Chippewa are American (40.8%, a difference of 0.050%), Immigrants from Laos (40.7%, a difference of 0.18%), Central American Indian (40.8%, a difference of 0.23%), Belizean (40.6%, a difference of 0.25%), and Hawaiian (40.9%, a difference of 0.42%).
| Demographics | Rating | Rank | Associate's Degree |
| Immigrants | Jamaica | 0.3 /100 | #263 | Tragic 41.5% |
| Osage | 0.3 /100 | #264 | Tragic 41.5% |
| Africans | 0.2 /100 | #265 | Tragic 41.1% |
| Samoans | 0.2 /100 | #266 | Tragic 41.1% |
| Hawaiians | 0.2 /100 | #267 | Tragic 40.9% |
| Central American Indians | 0.2 /100 | #268 | Tragic 40.8% |
| Americans | 0.2 /100 | #269 | Tragic 40.8% |
| Chippewa | 0.2 /100 | #270 | Tragic 40.7% |
| Immigrants | Laos | 0.1 /100 | #271 | Tragic 40.7% |
| Belizeans | 0.1 /100 | #272 | Tragic 40.6% |
| Puget Sound Salish | 0.1 /100 | #273 | Tragic 40.5% |
| Immigrants | Dominica | 0.1 /100 | #274 | Tragic 40.5% |
| Potawatomi | 0.1 /100 | #275 | Tragic 40.4% |
| Puerto Ricans | 0.1 /100 | #276 | Tragic 40.4% |
| Blackfeet | 0.1 /100 | #277 | Tragic 40.3% |
Demographics Similar to Immigrants from Syria by Associate's Degree
In terms of associate's degree, the demographic groups most similar to Immigrants from Syria are Immigrants from Uganda (48.5%, a difference of 0.010%), Chinese (48.5%, a difference of 0.090%), Serbian (48.5%, a difference of 0.10%), Immigrants from Eastern Africa (48.4%, a difference of 0.13%), and Swedish (48.4%, a difference of 0.16%).
| Demographics | Rating | Rank | Associate's Degree |
| Lebanese | 94.6 /100 | #119 | Exceptional 48.8% |
| Alsatians | 94.6 /100 | #120 | Exceptional 48.8% |
| Ugandans | 93.9 /100 | #121 | Exceptional 48.7% |
| Italians | 93.9 /100 | #122 | Exceptional 48.7% |
| Brazilians | 93.7 /100 | #123 | Exceptional 48.7% |
| Serbians | 92.6 /100 | #124 | Exceptional 48.5% |
| Chinese | 92.5 /100 | #125 | Exceptional 48.5% |
| Immigrants | Syria | 92.2 /100 | #126 | Exceptional 48.5% |
| Immigrants | Uganda | 92.1 /100 | #127 | Exceptional 48.5% |
| Immigrants | Eastern Africa | 91.6 /100 | #128 | Exceptional 48.4% |
| Swedes | 91.5 /100 | #129 | Exceptional 48.4% |
| Immigrants | Jordan | 91.2 /100 | #130 | Exceptional 48.4% |
| Icelanders | 90.8 /100 | #131 | Exceptional 48.3% |
| Immigrants | Albania | 89.9 /100 | #132 | Excellent 48.2% |
| Assyrians/Chaldeans/Syriacs | 89.4 /100 | #133 | Excellent 48.2% |