Chippewa vs Immigrants from Senegal Single Mother Households
COMPARE
Chippewa
Immigrants from Senegal
Single Mother Households
Single Mother Households Comparison
Chippewa
Immigrants from Senegal
8.0%
SINGLE MOTHER HOUSEHOLDS
0.0/ 100
METRIC RATING
301st/ 347
METRIC RANK
8.3%
SINGLE MOTHER HOUSEHOLDS
0.0/ 100
METRIC RATING
321st/ 347
METRIC RANK
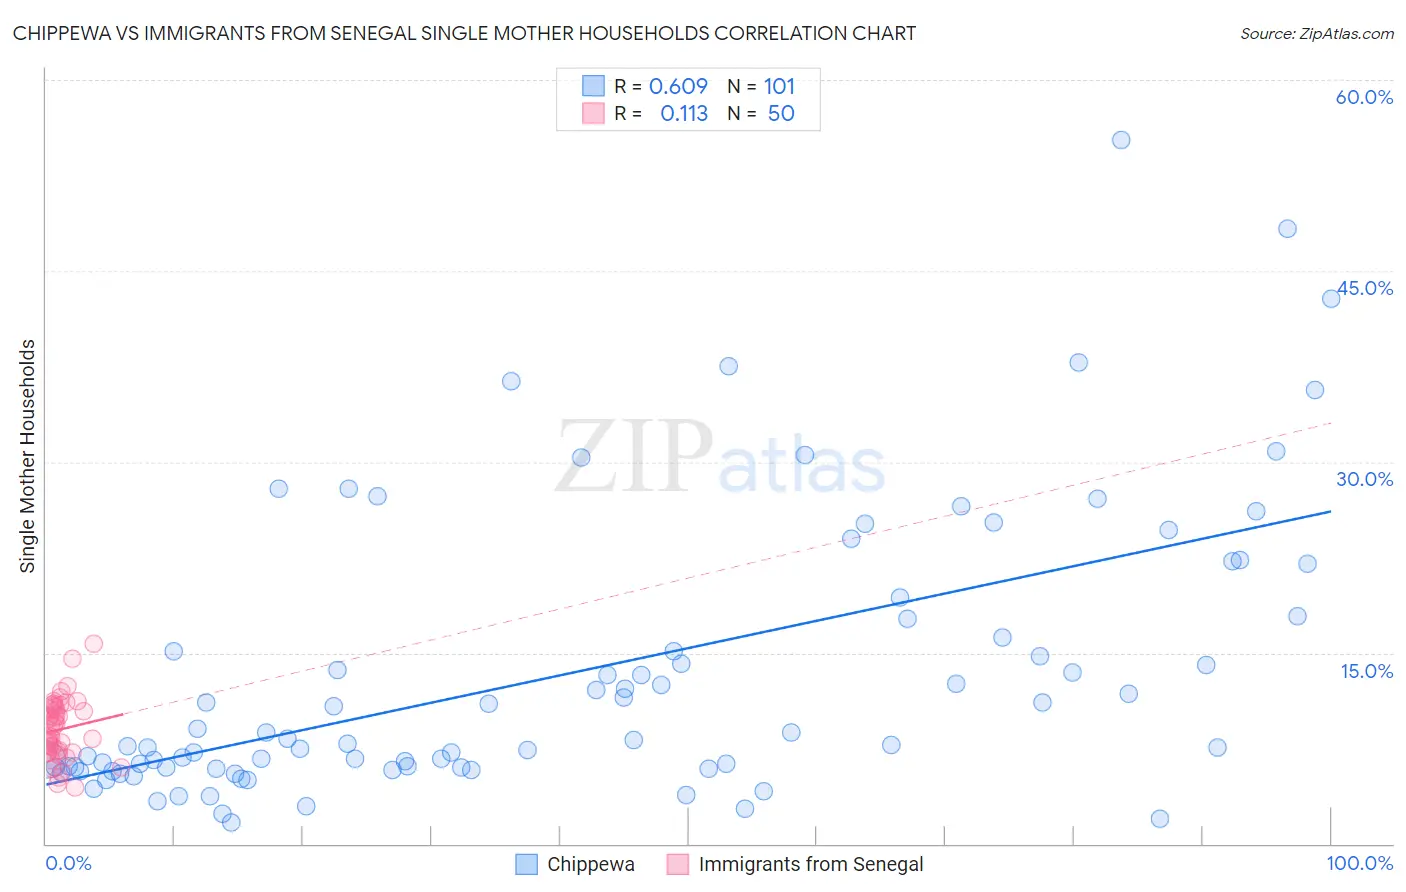
Chippewa vs Immigrants from Senegal Single Mother Households Correlation Chart
The statistical analysis conducted on geographies consisting of 214,662,896 people shows a significant positive correlation between the proportion of Chippewa and percentage of single mother households in the United States with a correlation coefficient (R) of 0.609 and weighted average of 8.0%. Similarly, the statistical analysis conducted on geographies consisting of 90,052,902 people shows a poor positive correlation between the proportion of Immigrants from Senegal and percentage of single mother households in the United States with a correlation coefficient (R) of 0.113 and weighted average of 8.3%, a difference of 3.7%.
Single Mother Households Correlation Summary
| Measurement | Chippewa | Immigrants from Senegal |
| Minimum | 1.7% | 4.4% |
| Maximum | 55.3% | 15.7% |
| Range | 53.6% | 11.3% |
| Mean | 13.4% | 9.0% |
| Median | 8.2% | 8.8% |
| Interquartile 25% (IQ1) | 6.0% | 7.2% |
| Interquartile 75% (IQ3) | 17.8% | 10.7% |
| Interquartile Range (IQR) | 11.8% | 3.5% |
| Standard Deviation (Sample) | 11.0% | 2.4% |
| Standard Deviation (Population) | 11.0% | 2.3% |
Demographics Similar to Chippewa and Immigrants from Senegal by Single Mother Households
In terms of single mother households, the demographic groups most similar to Chippewa are Immigrants from Ghana (8.0%, a difference of 0.10%), Immigrants from Bahamas (8.0%, a difference of 0.12%), Native/Alaskan (8.0%, a difference of 0.56%), Colville (8.0%, a difference of 0.61%), and Immigrants from Barbados (8.0%, a difference of 0.68%). Similarly, the demographic groups most similar to Immigrants from Senegal are Bahamian (8.3%, a difference of 0.24%), Jamaican (8.2%, a difference of 0.36%), Senegalese (8.2%, a difference of 0.47%), Immigrants from Honduras (8.2%, a difference of 1.0%), and African (8.2%, a difference of 1.2%).
| Demographics | Rating | Rank | Single Mother Households |
| Chippewa | 0.0 /100 | #301 | Tragic 8.0% |
| Immigrants | Ghana | 0.0 /100 | #302 | Tragic 8.0% |
| Immigrants | Bahamas | 0.0 /100 | #303 | Tragic 8.0% |
| Natives/Alaskans | 0.0 /100 | #304 | Tragic 8.0% |
| Colville | 0.0 /100 | #305 | Tragic 8.0% |
| Immigrants | Barbados | 0.0 /100 | #306 | Tragic 8.0% |
| Immigrants | St. Vincent and the Grenadines | 0.0 /100 | #307 | Tragic 8.0% |
| Immigrants | Central America | 0.0 /100 | #308 | Tragic 8.1% |
| Cheyenne | 0.0 /100 | #309 | Tragic 8.1% |
| Hondurans | 0.0 /100 | #310 | Tragic 8.1% |
| Immigrants | Congo | 0.0 /100 | #311 | Tragic 8.1% |
| Bangladeshis | 0.0 /100 | #312 | Tragic 8.1% |
| Immigrants | Grenada | 0.0 /100 | #313 | Tragic 8.2% |
| Immigrants | Mexico | 0.0 /100 | #314 | Tragic 8.2% |
| Immigrants | Western Africa | 0.0 /100 | #315 | Tragic 8.2% |
| Africans | 0.0 /100 | #316 | Tragic 8.2% |
| Immigrants | Honduras | 0.0 /100 | #317 | Tragic 8.2% |
| Senegalese | 0.0 /100 | #318 | Tragic 8.2% |
| Jamaicans | 0.0 /100 | #319 | Tragic 8.2% |
| Bahamians | 0.0 /100 | #320 | Tragic 8.3% |
| Immigrants | Senegal | 0.0 /100 | #321 | Tragic 8.3% |