Chippewa vs Nonimmigrants Associate's Degree
COMPARE
Chippewa
Nonimmigrants
Associate's Degree
Associate's Degree Comparison
Chippewa
Nonimmigrants
40.7%
ASSOCIATE'S DEGREE
0.2/ 100
METRIC RATING
270th/ 347
METRIC RANK
42.9%
ASSOCIATE'S DEGREE
1.9/ 100
METRIC RATING
237th/ 347
METRIC RANK
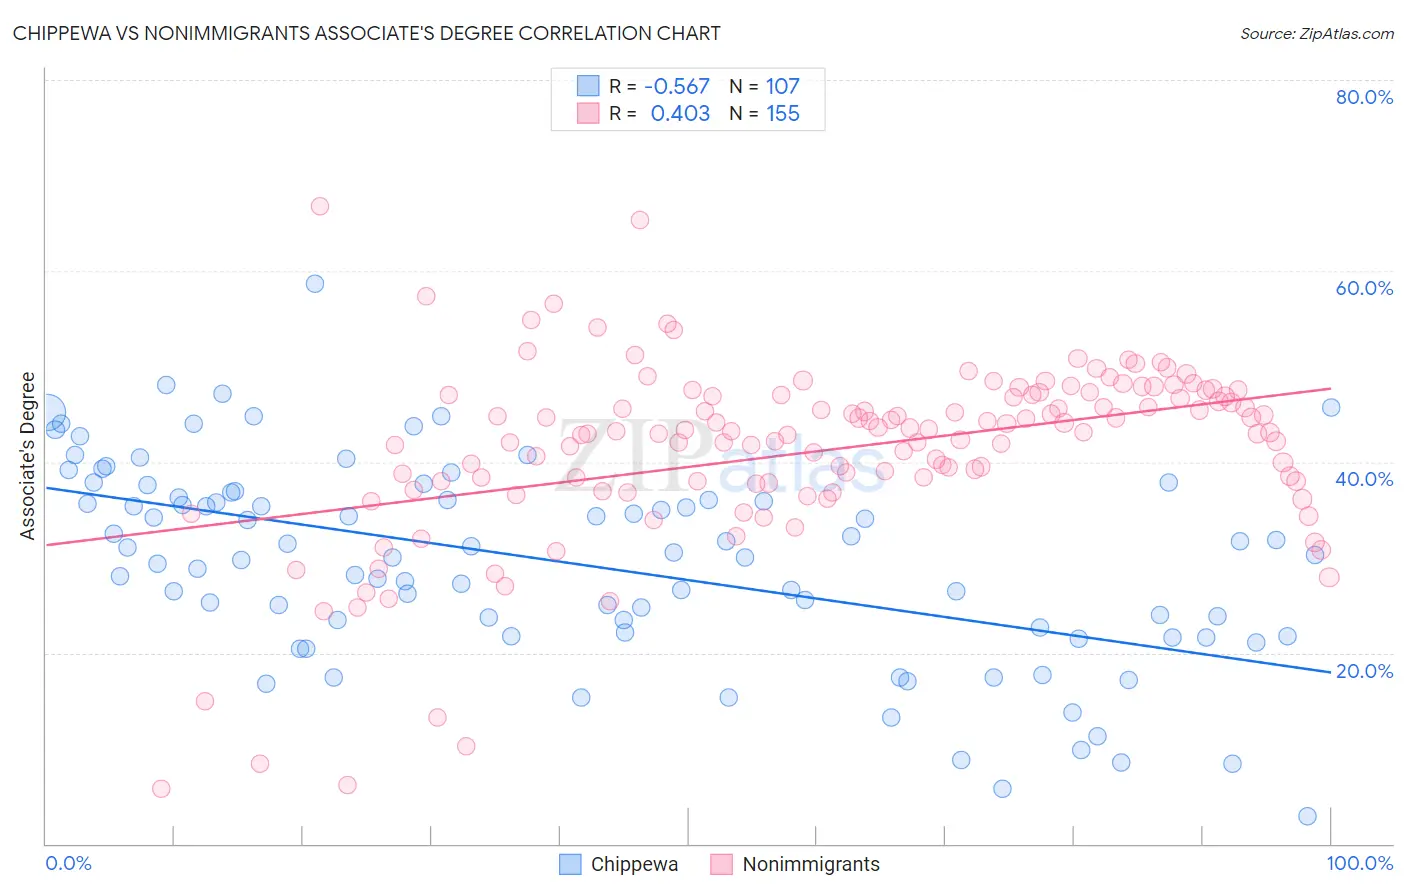
Chippewa vs Nonimmigrants Associate's Degree Correlation Chart
The statistical analysis conducted on geographies consisting of 215,061,498 people shows a substantial negative correlation between the proportion of Chippewa and percentage of population with at least associate's degree education in the United States with a correlation coefficient (R) of -0.567 and weighted average of 40.7%. Similarly, the statistical analysis conducted on geographies consisting of 585,078,225 people shows a moderate positive correlation between the proportion of Nonimmigrants and percentage of population with at least associate's degree education in the United States with a correlation coefficient (R) of 0.403 and weighted average of 42.9%, a difference of 5.4%.
Associate's Degree Correlation Summary
| Measurement | Chippewa | Nonimmigrants |
| Minimum | 2.9% | 5.7% |
| Maximum | 58.7% | 66.8% |
| Range | 55.8% | 61.1% |
| Mean | 29.5% | 41.2% |
| Median | 30.2% | 43.1% |
| Interquartile 25% (IQ1) | 22.1% | 37.8% |
| Interquartile 75% (IQ3) | 36.2% | 47.0% |
| Interquartile Range (IQR) | 14.1% | 9.2% |
| Standard Deviation (Sample) | 10.5% | 9.6% |
| Standard Deviation (Population) | 10.4% | 9.6% |
Similar Demographics by Associate's Degree
Demographics Similar to Chippewa by Associate's Degree
In terms of associate's degree, the demographic groups most similar to Chippewa are American (40.8%, a difference of 0.050%), Immigrants from Laos (40.7%, a difference of 0.18%), Central American Indian (40.8%, a difference of 0.23%), Belizean (40.6%, a difference of 0.25%), and Hawaiian (40.9%, a difference of 0.42%).
| Demographics | Rating | Rank | Associate's Degree |
| Immigrants | Jamaica | 0.3 /100 | #263 | Tragic 41.5% |
| Osage | 0.3 /100 | #264 | Tragic 41.5% |
| Africans | 0.2 /100 | #265 | Tragic 41.1% |
| Samoans | 0.2 /100 | #266 | Tragic 41.1% |
| Hawaiians | 0.2 /100 | #267 | Tragic 40.9% |
| Central American Indians | 0.2 /100 | #268 | Tragic 40.8% |
| Americans | 0.2 /100 | #269 | Tragic 40.8% |
| Chippewa | 0.2 /100 | #270 | Tragic 40.7% |
| Immigrants | Laos | 0.1 /100 | #271 | Tragic 40.7% |
| Belizeans | 0.1 /100 | #272 | Tragic 40.6% |
| Puget Sound Salish | 0.1 /100 | #273 | Tragic 40.5% |
| Immigrants | Dominica | 0.1 /100 | #274 | Tragic 40.5% |
| Potawatomi | 0.1 /100 | #275 | Tragic 40.4% |
| Puerto Ricans | 0.1 /100 | #276 | Tragic 40.4% |
| Blackfeet | 0.1 /100 | #277 | Tragic 40.3% |
Demographics Similar to Nonimmigrants by Associate's Degree
In terms of associate's degree, the demographic groups most similar to Nonimmigrants are Immigrants from St. Vincent and the Grenadines (42.9%, a difference of 0.020%), Ecuadorian (43.0%, a difference of 0.10%), Tlingit-Haida (43.0%, a difference of 0.20%), Iroquois (42.8%, a difference of 0.26%), and Tongan (43.0%, a difference of 0.29%).
| Demographics | Rating | Rank | Associate's Degree |
| Immigrants | Barbados | 2.9 /100 | #230 | Tragic 43.3% |
| Liberians | 2.9 /100 | #231 | Tragic 43.3% |
| Native Hawaiians | 2.3 /100 | #232 | Tragic 43.1% |
| Tongans | 2.2 /100 | #233 | Tragic 43.0% |
| Tlingit-Haida | 2.1 /100 | #234 | Tragic 43.0% |
| Ecuadorians | 2.0 /100 | #235 | Tragic 43.0% |
| Immigrants | St. Vincent and the Grenadines | 1.9 /100 | #236 | Tragic 42.9% |
| Immigrants | Nonimmigrants | 1.9 /100 | #237 | Tragic 42.9% |
| Iroquois | 1.7 /100 | #238 | Tragic 42.8% |
| Immigrants | Grenada | 1.3 /100 | #239 | Tragic 42.6% |
| Cree | 1.2 /100 | #240 | Tragic 42.5% |
| British West Indians | 1.0 /100 | #241 | Tragic 42.4% |
| Immigrants | West Indies | 1.0 /100 | #242 | Tragic 42.4% |
| Guyanese | 1.0 /100 | #243 | Tragic 42.3% |
| Immigrants | Liberia | 0.9 /100 | #244 | Tragic 42.3% |