Chippewa vs Immigrants from Jordan Doctorate Degree
COMPARE
Chippewa
Immigrants from Jordan
Doctorate Degree
Doctorate Degree Comparison
Chippewa
Immigrants from Jordan
1.5%
DOCTORATE DEGREE
0.9/ 100
METRIC RATING
257th/ 347
METRIC RANK
2.0%
DOCTORATE DEGREE
94.8/ 100
METRIC RATING
121st/ 347
METRIC RANK
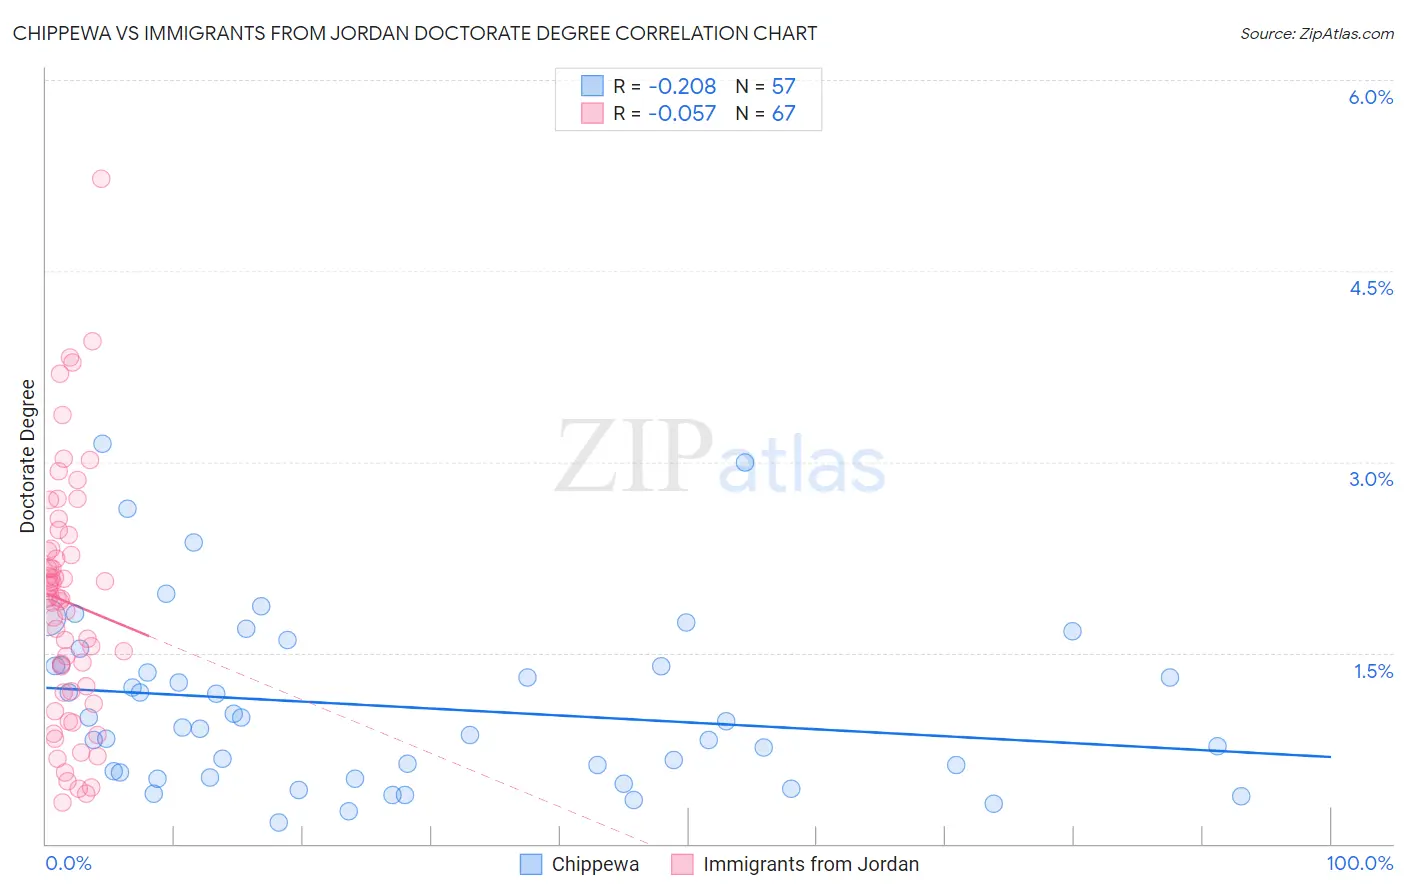
Chippewa vs Immigrants from Jordan Doctorate Degree Correlation Chart
The statistical analysis conducted on geographies consisting of 212,158,664 people shows a weak negative correlation between the proportion of Chippewa and percentage of population with at least doctorate degree education in the United States with a correlation coefficient (R) of -0.208 and weighted average of 1.5%. Similarly, the statistical analysis conducted on geographies consisting of 180,883,250 people shows a slight negative correlation between the proportion of Immigrants from Jordan and percentage of population with at least doctorate degree education in the United States with a correlation coefficient (R) of -0.057 and weighted average of 2.0%, a difference of 33.4%.
Doctorate Degree Correlation Summary
| Measurement | Chippewa | Immigrants from Jordan |
| Minimum | 0.17% | 0.32% |
| Maximum | 3.1% | 5.2% |
| Range | 3.0% | 4.9% |
| Mean | 1.1% | 1.9% |
| Median | 0.91% | 1.9% |
| Interquartile 25% (IQ1) | 0.54% | 1.2% |
| Interquartile 75% (IQ3) | 1.4% | 2.3% |
| Interquartile Range (IQR) | 0.86% | 1.1% |
| Standard Deviation (Sample) | 0.67% | 0.98% |
| Standard Deviation (Population) | 0.67% | 0.97% |
Similar Demographics by Doctorate Degree
Demographics Similar to Chippewa by Doctorate Degree
In terms of doctorate degree, the demographic groups most similar to Chippewa are Central American Indian (1.5%, a difference of 0.22%), Immigrants from West Indies (1.5%, a difference of 0.26%), Immigrants from Cambodia (1.5%, a difference of 0.27%), Trinidadian and Tobagonian (1.5%, a difference of 0.27%), and Liberian (1.5%, a difference of 0.28%).
| Demographics | Rating | Rank | Doctorate Degree |
| Immigrants | Fiji | 1.6 /100 | #250 | Tragic 1.6% |
| Apache | 1.3 /100 | #251 | Tragic 1.5% |
| Yuman | 1.1 /100 | #252 | Tragic 1.5% |
| Americans | 1.0 /100 | #253 | Tragic 1.5% |
| Immigrants | Cambodia | 1.0 /100 | #254 | Tragic 1.5% |
| Trinidadians and Tobagonians | 1.0 /100 | #255 | Tragic 1.5% |
| Central American Indians | 1.0 /100 | #256 | Tragic 1.5% |
| Chippewa | 0.9 /100 | #257 | Tragic 1.5% |
| Immigrants | West Indies | 0.9 /100 | #258 | Tragic 1.5% |
| Liberians | 0.9 /100 | #259 | Tragic 1.5% |
| Japanese | 0.9 /100 | #260 | Tragic 1.5% |
| Immigrants | Portugal | 0.8 /100 | #261 | Tragic 1.5% |
| Chickasaw | 0.7 /100 | #262 | Tragic 1.5% |
| Immigrants | Bahamas | 0.7 /100 | #263 | Tragic 1.5% |
| Blackfeet | 0.7 /100 | #264 | Tragic 1.5% |
Demographics Similar to Immigrants from Jordan by Doctorate Degree
In terms of doctorate degree, the demographic groups most similar to Immigrants from Jordan are Immigrants from Southern Europe (2.0%, a difference of 0.030%), Immigrants from Morocco (2.0%, a difference of 0.48%), Croatian (2.0%, a difference of 0.48%), Pakistani (2.0%, a difference of 0.76%), and Icelander (2.1%, a difference of 0.90%).
| Demographics | Rating | Rank | Doctorate Degree |
| Immigrants | Croatia | 96.8 /100 | #114 | Exceptional 2.1% |
| Taiwanese | 96.7 /100 | #115 | Exceptional 2.1% |
| Maltese | 96.2 /100 | #116 | Exceptional 2.1% |
| Lebanese | 96.0 /100 | #117 | Exceptional 2.1% |
| Icelanders | 96.0 /100 | #118 | Exceptional 2.1% |
| Pakistanis | 95.8 /100 | #119 | Exceptional 2.0% |
| Immigrants | Morocco | 95.5 /100 | #120 | Exceptional 2.0% |
| Immigrants | Jordan | 94.8 /100 | #121 | Exceptional 2.0% |
| Immigrants | Southern Europe | 94.7 /100 | #122 | Exceptional 2.0% |
| Croatians | 94.0 /100 | #123 | Exceptional 2.0% |
| Ute | 93.2 /100 | #124 | Exceptional 2.0% |
| Moroccans | 93.0 /100 | #125 | Exceptional 2.0% |
| Jordanians | 92.1 /100 | #126 | Exceptional 2.0% |
| Palestinians | 92.0 /100 | #127 | Exceptional 2.0% |
| Immigrants | Zaire | 91.1 /100 | #128 | Exceptional 2.0% |