Salvadoran vs Apache GED/Equivalency
COMPARE
Salvadoran
Apache
GED/Equivalency
GED/Equivalency Comparison
Salvadorans
Apache
78.6%
GED/EQUIVALENCY
0.0/ 100
METRIC RATING
333rd/ 347
METRIC RANK
80.7%
GED/EQUIVALENCY
0.0/ 100
METRIC RATING
315th/ 347
METRIC RANK
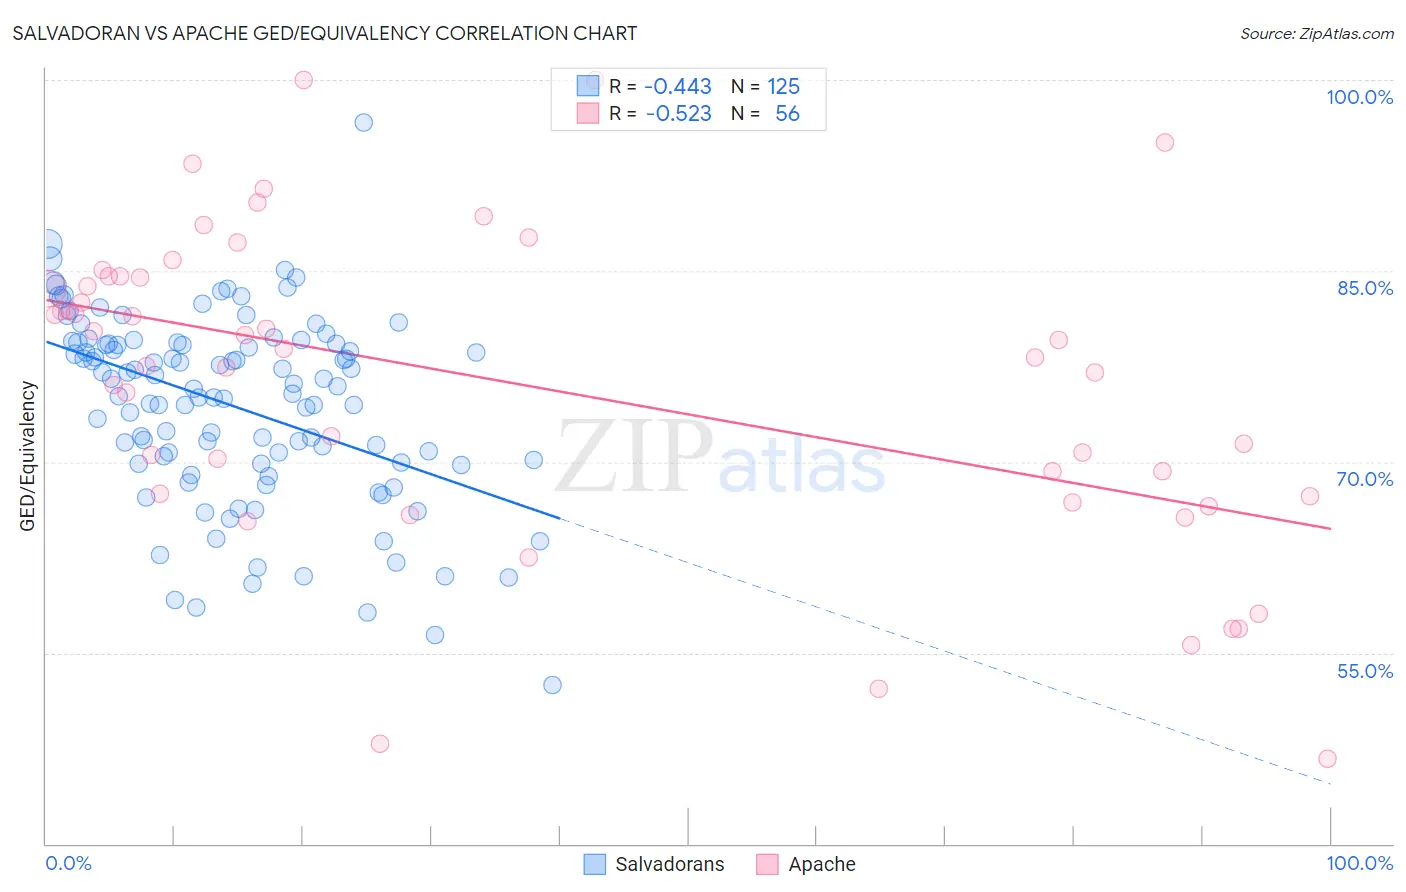
Salvadoran vs Apache GED/Equivalency Correlation Chart
The statistical analysis conducted on geographies consisting of 399,020,036 people shows a moderate negative correlation between the proportion of Salvadorans and percentage of population with at least ged/equivalency education in the United States with a correlation coefficient (R) of -0.443 and weighted average of 78.6%. Similarly, the statistical analysis conducted on geographies consisting of 231,143,029 people shows a substantial negative correlation between the proportion of Apache and percentage of population with at least ged/equivalency education in the United States with a correlation coefficient (R) of -0.523 and weighted average of 80.7%, a difference of 2.7%.
GED/Equivalency Correlation Summary
| Measurement | Salvadoran | Apache |
| Minimum | 52.4% | 46.7% |
| Maximum | 96.7% | 100.0% |
| Range | 44.2% | 53.3% |
| Mean | 74.4% | 76.1% |
| Median | 76.0% | 78.5% |
| Interquartile 25% (IQ1) | 69.9% | 67.4% |
| Interquartile 75% (IQ3) | 79.3% | 84.5% |
| Interquartile Range (IQR) | 9.4% | 17.1% |
| Standard Deviation (Sample) | 7.4% | 12.4% |
| Standard Deviation (Population) | 7.4% | 12.2% |
Demographics Similar to Salvadorans and Apache by GED/Equivalency
In terms of ged/equivalency, the demographic groups most similar to Salvadorans are Guatemalan (78.5%, a difference of 0.080%), Immigrants from the Azores (78.7%, a difference of 0.11%), Immigrants from Honduras (78.7%, a difference of 0.22%), Immigrants from Cabo Verde (78.9%, a difference of 0.47%), and Dominican (79.1%, a difference of 0.63%). Similarly, the demographic groups most similar to Apache are Central American Indian (80.6%, a difference of 0.13%), Immigrants from Caribbean (80.5%, a difference of 0.24%), Belizean (80.9%, a difference of 0.25%), Yaqui (80.5%, a difference of 0.26%), and Immigrants from Belize (80.5%, a difference of 0.26%).
| Demographics | Rating | Rank | GED/Equivalency |
| Belizeans | 0.0 /100 | #314 | Tragic 80.9% |
| Apache | 0.0 /100 | #315 | Tragic 80.7% |
| Central American Indians | 0.0 /100 | #316 | Tragic 80.6% |
| Immigrants | Caribbean | 0.0 /100 | #317 | Tragic 80.5% |
| Yaqui | 0.0 /100 | #318 | Tragic 80.5% |
| Immigrants | Belize | 0.0 /100 | #319 | Tragic 80.5% |
| Immigrants | Cuba | 0.0 /100 | #320 | Tragic 80.2% |
| Yup'ik | 0.0 /100 | #321 | Tragic 80.0% |
| Lumbee | 0.0 /100 | #322 | Tragic 80.0% |
| Immigrants | Nicaragua | 0.0 /100 | #323 | Tragic 79.9% |
| Mexican American Indians | 0.0 /100 | #324 | Tragic 79.4% |
| Hondurans | 0.0 /100 | #325 | Tragic 79.3% |
| Yuman | 0.0 /100 | #326 | Tragic 79.2% |
| Central Americans | 0.0 /100 | #327 | Tragic 79.2% |
| Hispanics or Latinos | 0.0 /100 | #328 | Tragic 79.1% |
| Dominicans | 0.0 /100 | #329 | Tragic 79.1% |
| Immigrants | Cabo Verde | 0.0 /100 | #330 | Tragic 78.9% |
| Immigrants | Honduras | 0.0 /100 | #331 | Tragic 78.7% |
| Immigrants | Azores | 0.0 /100 | #332 | Tragic 78.7% |
| Salvadorans | 0.0 /100 | #333 | Tragic 78.6% |
| Guatemalans | 0.0 /100 | #334 | Tragic 78.5% |