Chickasaw vs Danish GED/Equivalency
COMPARE
Chickasaw
Danish
GED/Equivalency
GED/Equivalency Comparison
Chickasaw
Danes
83.8%
GED/EQUIVALENCY
1.2/ 100
METRIC RATING
246th/ 347
METRIC RANK
88.4%
GED/EQUIVALENCY
99.8/ 100
METRIC RATING
32nd/ 347
METRIC RANK
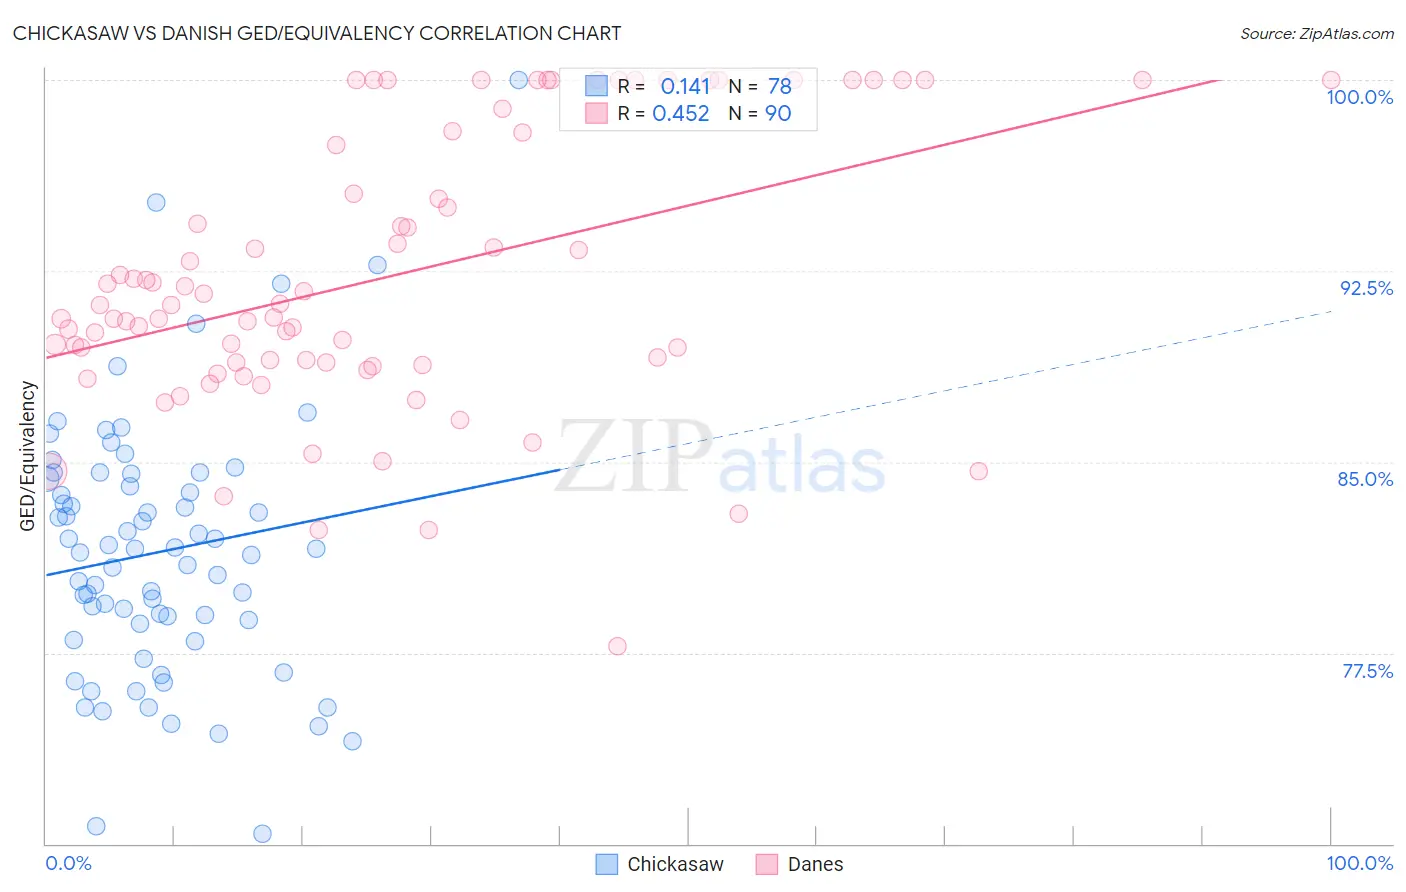
Chickasaw vs Danish GED/Equivalency Correlation Chart
The statistical analysis conducted on geographies consisting of 147,726,505 people shows a poor positive correlation between the proportion of Chickasaw and percentage of population with at least ged/equivalency education in the United States with a correlation coefficient (R) of 0.141 and weighted average of 83.8%. Similarly, the statistical analysis conducted on geographies consisting of 474,193,540 people shows a moderate positive correlation between the proportion of Danes and percentage of population with at least ged/equivalency education in the United States with a correlation coefficient (R) of 0.452 and weighted average of 88.4%, a difference of 5.5%.
GED/Equivalency Correlation Summary
| Measurement | Chickasaw | Danish |
| Minimum | 70.4% | 77.8% |
| Maximum | 100.0% | 100.0% |
| Range | 29.6% | 22.2% |
| Mean | 81.5% | 92.3% |
| Median | 81.5% | 91.2% |
| Interquartile 25% (IQ1) | 78.6% | 88.9% |
| Interquartile 75% (IQ3) | 84.3% | 97.9% |
| Interquartile Range (IQR) | 5.7% | 9.0% |
| Standard Deviation (Sample) | 5.1% | 5.4% |
| Standard Deviation (Population) | 5.1% | 5.3% |
Similar Demographics by GED/Equivalency
Demographics Similar to Chickasaw by GED/Equivalency
In terms of ged/equivalency, the demographic groups most similar to Chickasaw are Immigrants from Senegal (83.8%, a difference of 0.020%), Immigrants from Western Africa (83.8%, a difference of 0.030%), Immigrants from Ghana (83.9%, a difference of 0.050%), Blackfeet (83.8%, a difference of 0.050%), and Crow (83.8%, a difference of 0.050%).
| Demographics | Rating | Rank | GED/Equivalency |
| Immigrants | Bahamas | 2.6 /100 | #239 | Tragic 84.2% |
| Immigrants | South Eastern Asia | 2.5 /100 | #240 | Tragic 84.1% |
| Senegalese | 1.9 /100 | #241 | Tragic 84.0% |
| Sri Lankans | 1.9 /100 | #242 | Tragic 84.0% |
| Cherokee | 1.3 /100 | #243 | Tragic 83.9% |
| Immigrants | Ghana | 1.3 /100 | #244 | Tragic 83.9% |
| Immigrants | Senegal | 1.2 /100 | #245 | Tragic 83.8% |
| Chickasaw | 1.2 /100 | #246 | Tragic 83.8% |
| Immigrants | Western Africa | 1.1 /100 | #247 | Tragic 83.8% |
| Blackfeet | 1.1 /100 | #248 | Tragic 83.8% |
| Crow | 1.1 /100 | #249 | Tragic 83.8% |
| Shoshone | 1.0 /100 | #250 | Tragic 83.7% |
| Spanish Americans | 0.8 /100 | #251 | Tragic 83.6% |
| Bahamians | 0.8 /100 | #252 | Tragic 83.6% |
| Comanche | 0.7 /100 | #253 | Tragic 83.6% |
Demographics Similar to Danes by GED/Equivalency
In terms of ged/equivalency, the demographic groups most similar to Danes are Bhutanese (88.4%, a difference of 0.020%), Immigrants from Sweden (88.4%, a difference of 0.040%), Turkish (88.5%, a difference of 0.050%), Immigrants from Japan (88.4%, a difference of 0.050%), and Immigrants from South Central Asia (88.4%, a difference of 0.060%).
| Demographics | Rating | Rank | GED/Equivalency |
| Estonians | 99.8 /100 | #25 | Exceptional 88.6% |
| Immigrants | Australia | 99.8 /100 | #26 | Exceptional 88.6% |
| Immigrants | Lithuania | 99.8 /100 | #27 | Exceptional 88.6% |
| Immigrants | Northern Europe | 99.8 /100 | #28 | Exceptional 88.5% |
| Poles | 99.8 /100 | #29 | Exceptional 88.5% |
| Turks | 99.8 /100 | #30 | Exceptional 88.5% |
| Bhutanese | 99.8 /100 | #31 | Exceptional 88.4% |
| Danes | 99.8 /100 | #32 | Exceptional 88.4% |
| Immigrants | Sweden | 99.7 /100 | #33 | Exceptional 88.4% |
| Immigrants | Japan | 99.7 /100 | #34 | Exceptional 88.4% |
| Immigrants | South Central Asia | 99.7 /100 | #35 | Exceptional 88.4% |
| Immigrants | Belgium | 99.7 /100 | #36 | Exceptional 88.3% |
| Immigrants | Austria | 99.7 /100 | #37 | Exceptional 88.3% |
| Burmese | 99.7 /100 | #38 | Exceptional 88.3% |
| Immigrants | Israel | 99.6 /100 | #39 | Exceptional 88.2% |