Cherokee vs Pima Bachelor's Degree
COMPARE
Cherokee
Pima
Bachelor's Degree
Bachelor's Degree Comparison
Cherokee
Pima
30.2%
BACHELOR'S DEGREE
0.0/ 100
METRIC RATING
304th/ 347
METRIC RANK
23.2%
BACHELOR'S DEGREE
0.0/ 100
METRIC RATING
345th/ 347
METRIC RANK
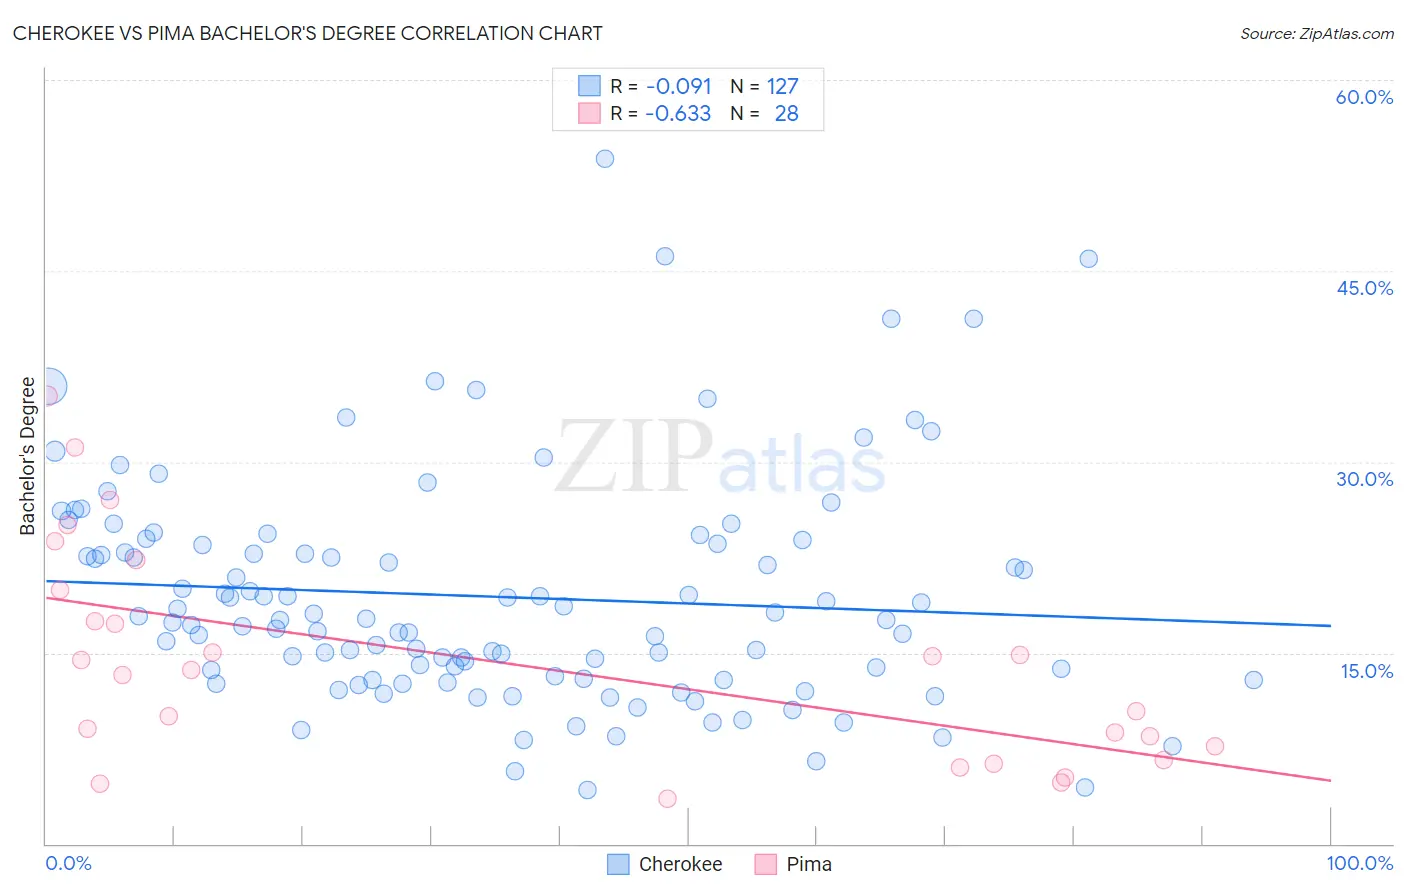
Cherokee vs Pima Bachelor's Degree Correlation Chart
The statistical analysis conducted on geographies consisting of 493,657,197 people shows a slight negative correlation between the proportion of Cherokee and percentage of population with at least bachelor's degree education in the United States with a correlation coefficient (R) of -0.091 and weighted average of 30.2%. Similarly, the statistical analysis conducted on geographies consisting of 61,550,117 people shows a significant negative correlation between the proportion of Pima and percentage of population with at least bachelor's degree education in the United States with a correlation coefficient (R) of -0.633 and weighted average of 23.2%, a difference of 30.1%.
Bachelor's Degree Correlation Summary
| Measurement | Cherokee | Pima |
| Minimum | 4.3% | 3.5% |
| Maximum | 53.8% | 35.2% |
| Range | 49.6% | 31.6% |
| Mean | 19.4% | 14.2% |
| Median | 17.6% | 13.4% |
| Interquartile 25% (IQ1) | 13.0% | 7.1% |
| Interquartile 75% (IQ3) | 23.6% | 18.7% |
| Interquartile Range (IQR) | 10.6% | 11.6% |
| Standard Deviation (Sample) | 8.9% | 8.5% |
| Standard Deviation (Population) | 8.8% | 8.3% |
Similar Demographics by Bachelor's Degree
Demographics Similar to Cherokee by Bachelor's Degree
In terms of bachelor's degree, the demographic groups most similar to Cherokee are Bangladeshi (30.2%, a difference of 0.010%), Mexican American Indian (30.2%, a difference of 0.17%), Immigrants from Latin America (30.1%, a difference of 0.42%), Immigrants from Cuba (30.3%, a difference of 0.45%), and Immigrants from Micronesia (30.4%, a difference of 0.67%).
| Demographics | Rating | Rank | Bachelor's Degree |
| Immigrants | Haiti | 0.0 /100 | #297 | Tragic 30.6% |
| Chippewa | 0.0 /100 | #298 | Tragic 30.6% |
| Chickasaw | 0.0 /100 | #299 | Tragic 30.4% |
| Immigrants | Micronesia | 0.0 /100 | #300 | Tragic 30.4% |
| Immigrants | Cuba | 0.0 /100 | #301 | Tragic 30.3% |
| Mexican American Indians | 0.0 /100 | #302 | Tragic 30.2% |
| Bangladeshis | 0.0 /100 | #303 | Tragic 30.2% |
| Cherokee | 0.0 /100 | #304 | Tragic 30.2% |
| Immigrants | Latin America | 0.0 /100 | #305 | Tragic 30.1% |
| Immigrants | Yemen | 0.0 /100 | #306 | Tragic 29.9% |
| Nepalese | 0.0 /100 | #307 | Tragic 29.9% |
| Cajuns | 0.0 /100 | #308 | Tragic 29.6% |
| Hispanics or Latinos | 0.0 /100 | #309 | Tragic 29.6% |
| Cheyenne | 0.0 /100 | #310 | Tragic 29.4% |
| Choctaw | 0.0 /100 | #311 | Tragic 29.4% |
Demographics Similar to Pima by Bachelor's Degree
In terms of bachelor's degree, the demographic groups most similar to Pima are Navajo (23.6%, a difference of 1.8%), Tohono O'odham (24.4%, a difference of 5.2%), Yakama (24.5%, a difference of 5.4%), Yuman (24.5%, a difference of 5.7%), and Lumbee (24.8%, a difference of 6.7%).
| Demographics | Rating | Rank | Bachelor's Degree |
| Mexicans | 0.0 /100 | #333 | Tragic 27.1% |
| Arapaho | 0.0 /100 | #334 | Tragic 26.6% |
| Natives/Alaskans | 0.0 /100 | #335 | Tragic 26.3% |
| Immigrants | Mexico | 0.0 /100 | #336 | Tragic 26.1% |
| Inupiat | 0.0 /100 | #337 | Tragic 25.8% |
| Pueblo | 0.0 /100 | #338 | Tragic 25.5% |
| Hopi | 0.0 /100 | #339 | Tragic 25.3% |
| Lumbee | 0.0 /100 | #340 | Tragic 24.8% |
| Yuman | 0.0 /100 | #341 | Tragic 24.5% |
| Yakama | 0.0 /100 | #342 | Tragic 24.5% |
| Tohono O'odham | 0.0 /100 | #343 | Tragic 24.4% |
| Navajo | 0.0 /100 | #344 | Tragic 23.6% |
| Pima | 0.0 /100 | #345 | Tragic 23.2% |
| Houma | 0.0 /100 | #346 | Tragic 21.4% |
| Yup'ik | 0.0 /100 | #347 | Tragic 19.4% |