Cherokee vs Japanese Bachelor's Degree
COMPARE
Cherokee
Japanese
Bachelor's Degree
Bachelor's Degree Comparison
Cherokee
Japanese
30.2%
BACHELOR'S DEGREE
0.0/ 100
METRIC RATING
304th/ 347
METRIC RANK
33.3%
BACHELOR'S DEGREE
0.7/ 100
METRIC RATING
251st/ 347
METRIC RANK
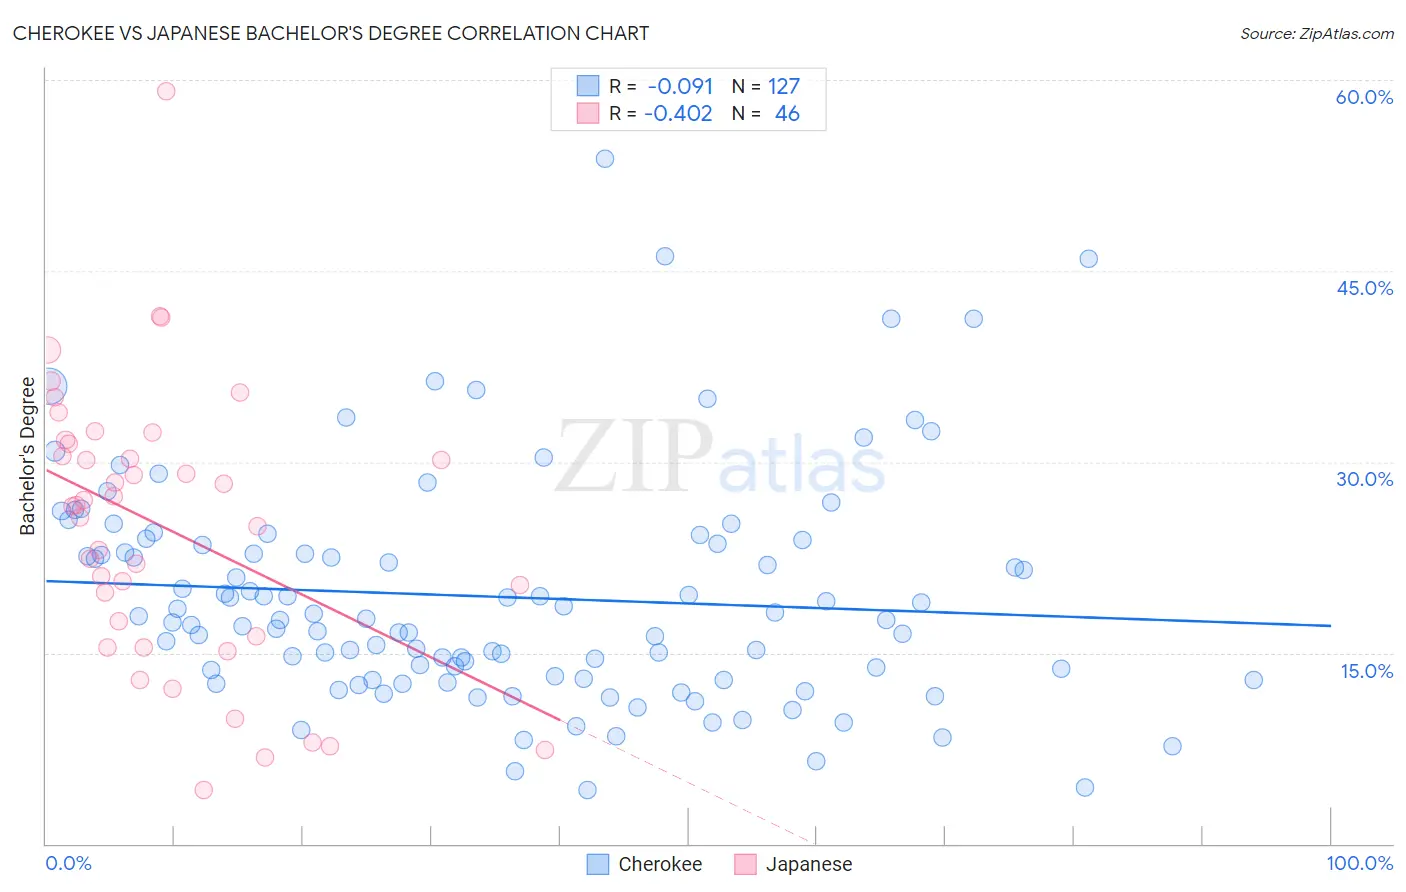
Cherokee vs Japanese Bachelor's Degree Correlation Chart
The statistical analysis conducted on geographies consisting of 493,657,197 people shows a slight negative correlation between the proportion of Cherokee and percentage of population with at least bachelor's degree education in the United States with a correlation coefficient (R) of -0.091 and weighted average of 30.2%. Similarly, the statistical analysis conducted on geographies consisting of 249,171,435 people shows a moderate negative correlation between the proportion of Japanese and percentage of population with at least bachelor's degree education in the United States with a correlation coefficient (R) of -0.402 and weighted average of 33.3%, a difference of 10.4%.
Bachelor's Degree Correlation Summary
| Measurement | Cherokee | Japanese |
| Minimum | 4.3% | 4.3% |
| Maximum | 53.8% | 59.2% |
| Range | 49.6% | 54.9% |
| Mean | 19.4% | 24.8% |
| Median | 17.6% | 26.5% |
| Interquartile 25% (IQ1) | 13.0% | 16.3% |
| Interquartile 75% (IQ3) | 23.6% | 31.5% |
| Interquartile Range (IQR) | 10.6% | 15.1% |
| Standard Deviation (Sample) | 8.9% | 11.0% |
| Standard Deviation (Population) | 8.8% | 10.8% |
Similar Demographics by Bachelor's Degree
Demographics Similar to Cherokee by Bachelor's Degree
In terms of bachelor's degree, the demographic groups most similar to Cherokee are Bangladeshi (30.2%, a difference of 0.010%), Mexican American Indian (30.2%, a difference of 0.17%), Immigrants from Latin America (30.1%, a difference of 0.42%), Immigrants from Cuba (30.3%, a difference of 0.45%), and Immigrants from Micronesia (30.4%, a difference of 0.67%).
| Demographics | Rating | Rank | Bachelor's Degree |
| Immigrants | Haiti | 0.0 /100 | #297 | Tragic 30.6% |
| Chippewa | 0.0 /100 | #298 | Tragic 30.6% |
| Chickasaw | 0.0 /100 | #299 | Tragic 30.4% |
| Immigrants | Micronesia | 0.0 /100 | #300 | Tragic 30.4% |
| Immigrants | Cuba | 0.0 /100 | #301 | Tragic 30.3% |
| Mexican American Indians | 0.0 /100 | #302 | Tragic 30.2% |
| Bangladeshis | 0.0 /100 | #303 | Tragic 30.2% |
| Cherokee | 0.0 /100 | #304 | Tragic 30.2% |
| Immigrants | Latin America | 0.0 /100 | #305 | Tragic 30.1% |
| Immigrants | Yemen | 0.0 /100 | #306 | Tragic 29.9% |
| Nepalese | 0.0 /100 | #307 | Tragic 29.9% |
| Cajuns | 0.0 /100 | #308 | Tragic 29.6% |
| Hispanics or Latinos | 0.0 /100 | #309 | Tragic 29.6% |
| Cheyenne | 0.0 /100 | #310 | Tragic 29.4% |
| Choctaw | 0.0 /100 | #311 | Tragic 29.4% |
Demographics Similar to Japanese by Bachelor's Degree
In terms of bachelor's degree, the demographic groups most similar to Japanese are Immigrants from Bahamas (33.3%, a difference of 0.070%), U.S. Virgin Islander (33.2%, a difference of 0.28%), Native Hawaiian (33.2%, a difference of 0.34%), Iroquois (33.2%, a difference of 0.36%), and Nicaraguan (33.1%, a difference of 0.54%).
| Demographics | Rating | Rank | Bachelor's Degree |
| Delaware | 1.2 /100 | #244 | Tragic 33.8% |
| Immigrants | Fiji | 1.2 /100 | #245 | Tragic 33.7% |
| Jamaicans | 1.0 /100 | #246 | Tragic 33.6% |
| Immigrants | Congo | 1.0 /100 | #247 | Tragic 33.6% |
| Cree | 1.0 /100 | #248 | Tragic 33.6% |
| Immigrants | Liberia | 0.9 /100 | #249 | Tragic 33.5% |
| Indonesians | 0.9 /100 | #250 | Tragic 33.5% |
| Japanese | 0.7 /100 | #251 | Tragic 33.3% |
| Immigrants | Bahamas | 0.7 /100 | #252 | Tragic 33.3% |
| U.S. Virgin Islanders | 0.7 /100 | #253 | Tragic 33.2% |
| Native Hawaiians | 0.7 /100 | #254 | Tragic 33.2% |
| Iroquois | 0.7 /100 | #255 | Tragic 33.2% |
| Nicaraguans | 0.6 /100 | #256 | Tragic 33.1% |
| Spanish Americans | 0.6 /100 | #257 | Tragic 33.1% |
| French American Indians | 0.6 /100 | #258 | Tragic 33.1% |