Cherokee vs Immigrants from Moldova Bachelor's Degree

COMPARE

Cherokee
Race
Ancestry
AfghanAfricanAlaska NativeAlaskan AthabascanAlbanianAleutAlsatianAmericanApacheArabArapahoArgentineanArmenianAssyrian/Chaldean/SyriacAustralianAustrianBahamianBangladeshiBarbadianBasqueBelgianBelizeanBermudanBhutaneseBlackfeetBolivianBrazilianBritishBritish West IndianBulgarianBurmeseCajunCambodianCanadianCape VerdeanCarpatho RusynCelticCentral AmericanCentral American IndianCherokeeCheyenneChickasawChileanChineseChippewaChoctawColombianColvilleComancheCosta RicanCreeCreekCroatianCrowCubanCypriotCzechCzechoslovakianDanishDelawareDominicanDutchDutch West IndianEastern EuropeanEcuadorianEgyptianEnglishEstonianEthiopianEuropeanFijianFilipinoFinnishFrenchFrench American IndianFrench CanadianGermanGerman RussianGhanaianGreekGuamanian/ChamorroGuatemalanGuyaneseHaitianHmongHonduranHopiHoumaHungarianIcelanderIndian (Asian)IndonesianInupiatIranianIraqiIrishIroquoisIsraeliItalianJamaicanJapaneseJordanianKenyanKiowaKoreanLaotianLatvianLebaneseLiberianLithuanianLumbeeLuxembourgerMacedonianMalaysianMalteseMarshalleseMenomineeMexicanMexican American IndianMongolianMoroccanNative HawaiianNavajoNepaleseNew ZealanderNicaraguanNigerianNorthern EuropeanNorwegianOkinawanOsageOttawaPaiutePakistaniPalestinianPanamanianParaguayanPennsylvania GermanPeruvianPimaPolishPortuguesePotawatomiPuebloPuerto RicanPuget Sound SalishRomanianRussianSalvadoranSamoanScandinavianScotch-IrishScottishSeminoleSenegaleseSerbianShoshoneSierra LeoneanSiouxSlavicSlovakSloveneSomaliSouth AfricanSouth AmericanSouth American IndianSoviet UnionSpaniardSpanishSpanish AmericanSpanish American IndianSri LankanSubsaharan AfricanSudaneseSwedishSwissSyrianTaiwaneseThaiTlingit-HaidaTohono O'OdhamTonganTrinidadian and TobagonianTsimshianTurkishU.S. Virgin IslanderUgandanUkrainianUruguayanUteVenezuelanVietnameseWelshWest IndianYakamaYaquiYugoslavianYumanYup'ikZimbabwean
Immigration
NonimmigrantsImmigrantsAfghanistanAfricaAlbaniaArgentinaArmeniaAsiaAustraliaAustriaBahamasBangladeshBarbadosBelarusBelgiumBelizeBoliviaBosnia and HerzegovinaBrazilBulgariaBurma/MyanmarCabo VerdeCambodiaCameroonCanadaCaribbeanCentral AmericaChileChinaColombiaCongoCosta RicaCroatiaCubaCzechoslovakiaDenmarkDominicaDominican RepublicEastern AfricaEastern AsiaEastern EuropeEcuadorEgyptEl SalvadorEnglandEritreaEthiopiaEuropeFijiFranceGermanyGhanaGreeceGrenadaGuatemalaGuyanaHaitiHondurasHong KongHungaryIndiaIndonesiaIranIraqIrelandIsraelItalyJamaicaJapanJordanKazakhstanKenyaKoreaKuwaitLaosLatin AmericaLatviaLebanonLiberiaLithuaniaMalaysiaMexicoMicronesiaMiddle AfricaMoroccoNepalNetherlandsNicaraguaNigeriaNorth AmericaNorth MacedoniaNorthern AfricaNorthern EuropeNorwayOceaniaPakistanPanamaPeruPhilippinesPolandPortugalRomaniaRussiaSaudi ArabiaScotlandSenegalSerbiaSierra LeoneSingaporeSomaliaSouth AfricaSouth AmericaSouth Central AsiaSouth Eastern AsiaSouthern EuropeSpainSri LankaSt. Vincent and the GrenadinesSudanSwedenSwitzerlandSyriaTaiwanThailandTrinidad and TobagoTurkeyUgandaUkraineUruguayUzbekistanVenezuelaVietnamWest IndiesWestern AfricaWestern AsiaWestern EuropeYemenZaireZimbabweAzores
Immigrants from Moldova
Race
Ancestry
AfghanAfricanAlaska NativeAlaskan AthabascanAlbanianAleutAlsatianAmericanApacheArabArapahoArgentineanArmenianAssyrian/Chaldean/SyriacAustralianAustrianBahamianBangladeshiBarbadianBasqueBelgianBelizeanBermudanBhutaneseBlackfeetBolivianBrazilianBritishBritish West IndianBulgarianBurmeseCajunCambodianCanadianCape VerdeanCarpatho RusynCelticCentral AmericanCentral American IndianCheyenneChickasawChileanChineseChippewaChoctawColombianColvilleComancheCosta RicanCreeCreekCroatianCrowCubanCypriotCzechCzechoslovakianDanishDelawareDominicanDutchDutch West IndianEastern EuropeanEcuadorianEgyptianEnglishEstonianEthiopianEuropeanFijianFilipinoFinnishFrenchFrench American IndianFrench CanadianGermanGerman RussianGhanaianGreekGuamanian/ChamorroGuatemalanGuyaneseHaitianHmongHonduranHopiHoumaHungarianIcelanderIndian (Asian)IndonesianInupiatIranianIraqiIrishIroquoisIsraeliItalianJamaicanJapaneseJordanianKenyanKiowaKoreanLaotianLatvianLebaneseLiberianLithuanianLumbeeLuxembourgerMacedonianMalaysianMalteseMarshalleseMenomineeMexicanMexican American IndianMongolianMoroccanNative HawaiianNavajoNepaleseNew ZealanderNicaraguanNigerianNorthern EuropeanNorwegianOkinawanOsageOttawaPaiutePakistaniPalestinianPanamanianParaguayanPennsylvania GermanPeruvianPimaPolishPortuguesePotawatomiPuebloPuerto RicanPuget Sound SalishRomanianRussianSalvadoranSamoanScandinavianScotch-IrishScottishSeminoleSenegaleseSerbianShoshoneSierra LeoneanSiouxSlavicSlovakSloveneSomaliSouth AfricanSouth AmericanSouth American IndianSoviet UnionSpaniardSpanishSpanish AmericanSpanish American IndianSri LankanSubsaharan AfricanSudaneseSwedishSwissSyrianTaiwaneseThaiTlingit-HaidaTohono O'OdhamTonganTrinidadian and TobagonianTsimshianTurkishU.S. Virgin IslanderUgandanUkrainianUruguayanUteVenezuelanVietnameseWelshWest IndianYakamaYaquiYugoslavianYumanYup'ikZimbabwean
Immigration
NonimmigrantsImmigrantsAfghanistanAfricaAlbaniaArgentinaArmeniaAsiaAustraliaAustriaBahamasBangladeshBarbadosBelarusBelgiumBelizeBoliviaBosnia and HerzegovinaBrazilBulgariaBurma/MyanmarCabo VerdeCambodiaCameroonCanadaCaribbeanCentral AmericaChileChinaColombiaCongoCosta RicaCroatiaCubaCzechoslovakiaDenmarkDominicaDominican RepublicEastern AfricaEastern AsiaEastern EuropeEcuadorEgyptEl SalvadorEnglandEritreaEthiopiaEuropeFijiFranceGermanyGhanaGreeceGrenadaGuatemalaGuyanaHaitiHondurasHong KongHungaryIndiaIndonesiaIranIraqIrelandIsraelItalyJamaicaJapanJordanKazakhstanKenyaKoreaKuwaitLaosLatin AmericaLatviaLebanonLiberiaLithuaniaMalaysiaMexicoMicronesiaMiddle AfricaMoldovaMoroccoNepalNetherlandsNicaraguaNigeriaNorth AmericaNorth MacedoniaNorthern AfricaNorthern EuropeNorwayOceaniaPakistanPanamaPeruPhilippinesPolandPortugalRomaniaRussiaSaudi ArabiaScotlandSenegalSerbiaSierra LeoneSingaporeSomaliaSouth AfricaSouth AmericaSouth Central AsiaSouth Eastern AsiaSouthern EuropeSpainSri LankaSt. Vincent and the GrenadinesSudanSwedenSwitzerlandSyriaTaiwanThailandTrinidad and TobagoTurkeyUgandaUkraineUruguayUzbekistanVenezuelaVietnamWest IndiesWestern AfricaWestern AsiaWestern EuropeYemenZaireZimbabweAzores
Bachelor's Degree
Income
Poverty
Unemployment
Labor Participation
Family Structure
Vehicle Availability
Education Level
Disability

Bachelor's Degree Comparison

Cherokee

Immigrants from Moldova

Tragic
Exceptional
30.2%
BACHELOR'S DEGREE
0.0/ 100
METRIC RATING
304th/ 347
METRIC RANK
41.6%
BACHELOR'S DEGREE
98.4/ 100
METRIC RATING
96th/ 347
METRIC RANK

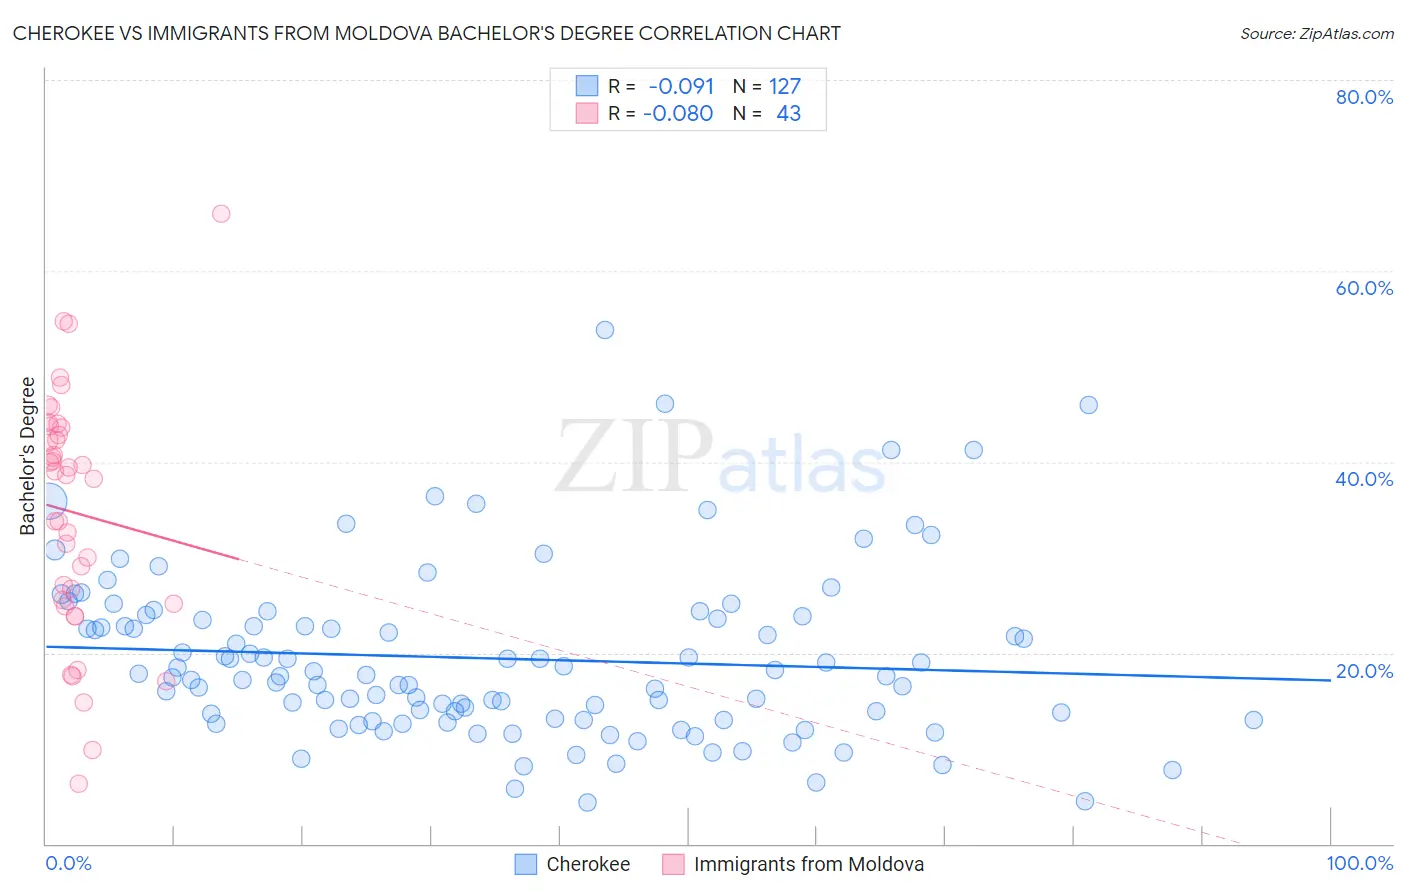
Cherokee vs Immigrants from Moldova Bachelor's Degree Correlation Chart

The statistical analysis conducted on geographies consisting of 493,657,197 people shows a slight negative correlation between the proportion of Cherokee and percentage of population with at least bachelor's degree education in the United States with a correlation coefficient (R) of -0.091 and weighted average of 30.2%. Similarly, the statistical analysis conducted on geographies consisting of 124,396,308 people shows a slight negative correlation between the proportion of Immigrants from Moldova and percentage of population with at least bachelor's degree education in the United States with a correlation coefficient (R) of -0.080 and weighted average of 41.6%, a difference of 37.8%.
Cherokee vs Immigrants from Moldova Bachelor's Degree

Bachelor's Degree Correlation Summary

MeasurementCherokeeImmigrants from Moldova
Minimum4.3%6.3%
Maximum53.8%66.0%
Range49.6%59.6%
Mean19.4%34.7%
Median17.6%38.7%
Interquartile 25% (IQ1)13.0%25.2%
Interquartile 75% (IQ3)23.6%43.6%
Interquartile Range (IQR)10.6%18.4%
Standard Deviation (Sample)8.9%12.7%
Standard Deviation (Population)8.8%12.6%

Similar Demographics by Bachelor's Degree

Demographics Similar to Cherokee by Bachelor's Degree

In terms of bachelor's degree, the demographic groups most similar to Cherokee are Bangladeshi (30.2%, a difference of 0.010%), Mexican American Indian (30.2%, a difference of 0.17%), Immigrants from Latin America (30.1%, a difference of 0.42%), Immigrants from Cuba (30.3%, a difference of 0.45%), and Immigrants from Micronesia (30.4%, a difference of 0.67%).
DemographicsRating | RankBachelor's Degree
Immigrants | Haiti
0.0
/100
|
#297
Tragic
30.6%
Chippewa
0.0
/100
|
#298
Tragic
30.6%
Chickasaw
0.0
/100
|
#299
Tragic
30.4%
Immigrants | Micronesia
0.0
/100
|
#300
Tragic
30.4%
Immigrants | Cuba
0.0
/100
|
#301
Tragic
30.3%
Mexican American Indians
0.0
/100
|
#302
Tragic
30.2%
Bangladeshis
0.0
/100
|
#303
Tragic
30.2%
Cherokee
0.0
/100
|
#304
Tragic
30.2%
Immigrants | Latin America
0.0
/100
|
#305
Tragic
30.1%
Immigrants | Yemen
0.0
/100
|
#306
Tragic
29.9%
Nepalese
0.0
/100
|
#307
Tragic
29.9%
Cajuns
0.0
/100
|
#308
Tragic
29.6%
Hispanics or Latinos
0.0
/100
|
#309
Tragic
29.6%
Cheyenne
0.0
/100
|
#310
Tragic
29.4%
Choctaw
0.0
/100
|
#311
Tragic
29.4%

Demographics Similar to Immigrants from Moldova by Bachelor's Degree

In terms of bachelor's degree, the demographic groups most similar to Immigrants from Moldova are Romanian (41.6%, a difference of 0.050%), Immigrants from North America (41.7%, a difference of 0.11%), Immigrants from Ukraine (41.5%, a difference of 0.16%), Immigrants from Nepal (41.7%, a difference of 0.23%), and Immigrants from Canada (41.7%, a difference of 0.26%).
DemographicsRating | RankBachelor's Degree
Greeks
99.0
/100
|
#89
Exceptional
42.0%
Laotians
98.9
/100
|
#90
Exceptional
42.0%
Immigrants | Northern Africa
98.9
/100
|
#91
Exceptional
41.9%
Maltese
98.8
/100
|
#92
Exceptional
41.9%
Immigrants | Canada
98.6
/100
|
#93
Exceptional
41.7%
Immigrants | Nepal
98.6
/100
|
#94
Exceptional
41.7%
Immigrants | North America
98.5
/100
|
#95
Exceptional
41.7%
Immigrants | Moldova
98.4
/100
|
#96
Exceptional
41.6%
Romanians
98.4
/100
|
#97
Exceptional
41.6%
Immigrants | Ukraine
98.3
/100
|
#98
Exceptional
41.5%
Immigrants | England
98.1
/100
|
#99
Exceptional
41.4%
Macedonians
98.1
/100
|
#100
Exceptional
41.4%
Immigrants | Morocco
98.0
/100
|
#101
Exceptional
41.4%
Immigrants | Italy
97.8
/100
|
#102
Exceptional
41.3%
Chileans
97.5
/100
|
#103
Exceptional
41.2%