Cherokee vs Immigrants from Belize Bachelor's Degree
COMPARE
Cherokee
Immigrants from Belize
Bachelor's Degree
Bachelor's Degree Comparison
Cherokee
Immigrants from Belize
30.2%
BACHELOR'S DEGREE
0.0/ 100
METRIC RATING
304th/ 347
METRIC RANK
32.1%
BACHELOR'S DEGREE
0.2/ 100
METRIC RATING
269th/ 347
METRIC RANK
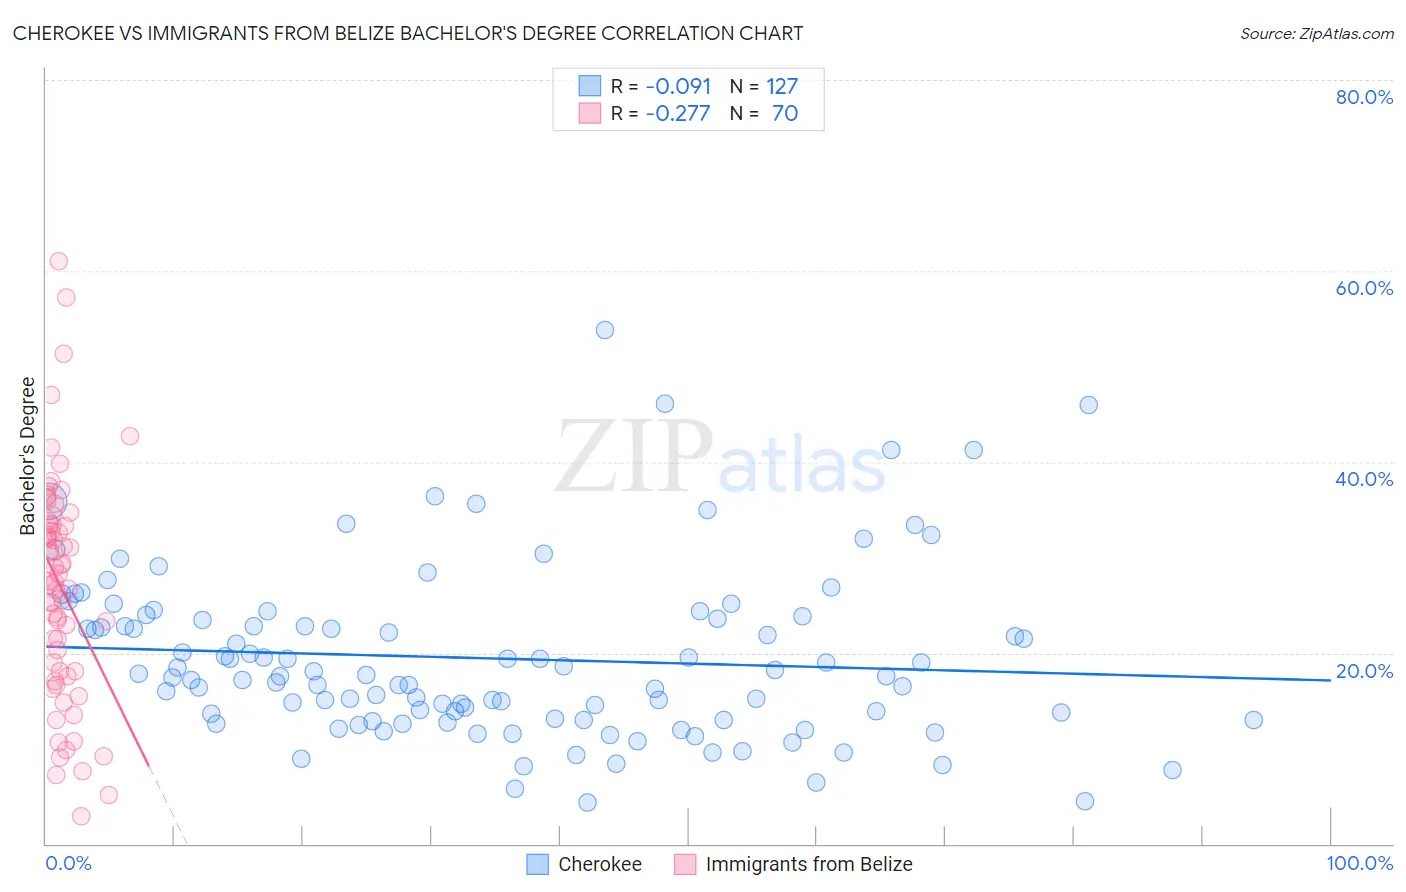
Cherokee vs Immigrants from Belize Bachelor's Degree Correlation Chart
The statistical analysis conducted on geographies consisting of 493,657,197 people shows a slight negative correlation between the proportion of Cherokee and percentage of population with at least bachelor's degree education in the United States with a correlation coefficient (R) of -0.091 and weighted average of 30.2%. Similarly, the statistical analysis conducted on geographies consisting of 130,322,630 people shows a weak negative correlation between the proportion of Immigrants from Belize and percentage of population with at least bachelor's degree education in the United States with a correlation coefficient (R) of -0.277 and weighted average of 32.1%, a difference of 6.4%.
Bachelor's Degree Correlation Summary
| Measurement | Cherokee | Immigrants from Belize |
| Minimum | 4.3% | 2.9% |
| Maximum | 53.8% | 61.0% |
| Range | 49.6% | 58.1% |
| Mean | 19.4% | 26.8% |
| Median | 17.6% | 27.4% |
| Interquartile 25% (IQ1) | 13.0% | 18.1% |
| Interquartile 75% (IQ3) | 23.6% | 33.5% |
| Interquartile Range (IQR) | 10.6% | 15.4% |
| Standard Deviation (Sample) | 8.9% | 11.8% |
| Standard Deviation (Population) | 8.8% | 11.7% |
Similar Demographics by Bachelor's Degree
Demographics Similar to Cherokee by Bachelor's Degree
In terms of bachelor's degree, the demographic groups most similar to Cherokee are Bangladeshi (30.2%, a difference of 0.010%), Mexican American Indian (30.2%, a difference of 0.17%), Immigrants from Latin America (30.1%, a difference of 0.42%), Immigrants from Cuba (30.3%, a difference of 0.45%), and Immigrants from Micronesia (30.4%, a difference of 0.67%).
| Demographics | Rating | Rank | Bachelor's Degree |
| Immigrants | Haiti | 0.0 /100 | #297 | Tragic 30.6% |
| Chippewa | 0.0 /100 | #298 | Tragic 30.6% |
| Chickasaw | 0.0 /100 | #299 | Tragic 30.4% |
| Immigrants | Micronesia | 0.0 /100 | #300 | Tragic 30.4% |
| Immigrants | Cuba | 0.0 /100 | #301 | Tragic 30.3% |
| Mexican American Indians | 0.0 /100 | #302 | Tragic 30.2% |
| Bangladeshis | 0.0 /100 | #303 | Tragic 30.2% |
| Cherokee | 0.0 /100 | #304 | Tragic 30.2% |
| Immigrants | Latin America | 0.0 /100 | #305 | Tragic 30.1% |
| Immigrants | Yemen | 0.0 /100 | #306 | Tragic 29.9% |
| Nepalese | 0.0 /100 | #307 | Tragic 29.9% |
| Cajuns | 0.0 /100 | #308 | Tragic 29.6% |
| Hispanics or Latinos | 0.0 /100 | #309 | Tragic 29.6% |
| Cheyenne | 0.0 /100 | #310 | Tragic 29.4% |
| Choctaw | 0.0 /100 | #311 | Tragic 29.4% |
Demographics Similar to Immigrants from Belize by Bachelor's Degree
In terms of bachelor's degree, the demographic groups most similar to Immigrants from Belize are Immigrants from Portugal (32.2%, a difference of 0.41%), Immigrants from Nicaragua (31.9%, a difference of 0.54%), Central American (31.9%, a difference of 0.63%), Comanche (31.9%, a difference of 0.66%), and American (31.9%, a difference of 0.78%).
| Demographics | Rating | Rank | Bachelor's Degree |
| Immigrants | Jamaica | 0.5 /100 | #262 | Tragic 32.9% |
| Belizeans | 0.4 /100 | #263 | Tragic 32.8% |
| Central American Indians | 0.3 /100 | #264 | Tragic 32.5% |
| Bahamians | 0.3 /100 | #265 | Tragic 32.5% |
| Immigrants | Dominica | 0.3 /100 | #266 | Tragic 32.5% |
| Cubans | 0.3 /100 | #267 | Tragic 32.5% |
| Immigrants | Portugal | 0.2 /100 | #268 | Tragic 32.2% |
| Immigrants | Belize | 0.2 /100 | #269 | Tragic 32.1% |
| Immigrants | Nicaragua | 0.2 /100 | #270 | Tragic 31.9% |
| Central Americans | 0.2 /100 | #271 | Tragic 31.9% |
| Comanche | 0.2 /100 | #272 | Tragic 31.9% |
| Americans | 0.2 /100 | #273 | Tragic 31.9% |
| Potawatomi | 0.2 /100 | #274 | Tragic 31.9% |
| Samoans | 0.1 /100 | #275 | Tragic 31.8% |
| Salvadorans | 0.1 /100 | #276 | Tragic 31.8% |