Cherokee vs Immigrants from Japan Bachelor's Degree
COMPARE
Cherokee
Immigrants from Japan
Bachelor's Degree
Bachelor's Degree Comparison
Cherokee
Immigrants from Japan
30.2%
BACHELOR'S DEGREE
0.0/ 100
METRIC RATING
304th/ 347
METRIC RANK
46.8%
BACHELOR'S DEGREE
100.0/ 100
METRIC RATING
26th/ 347
METRIC RANK
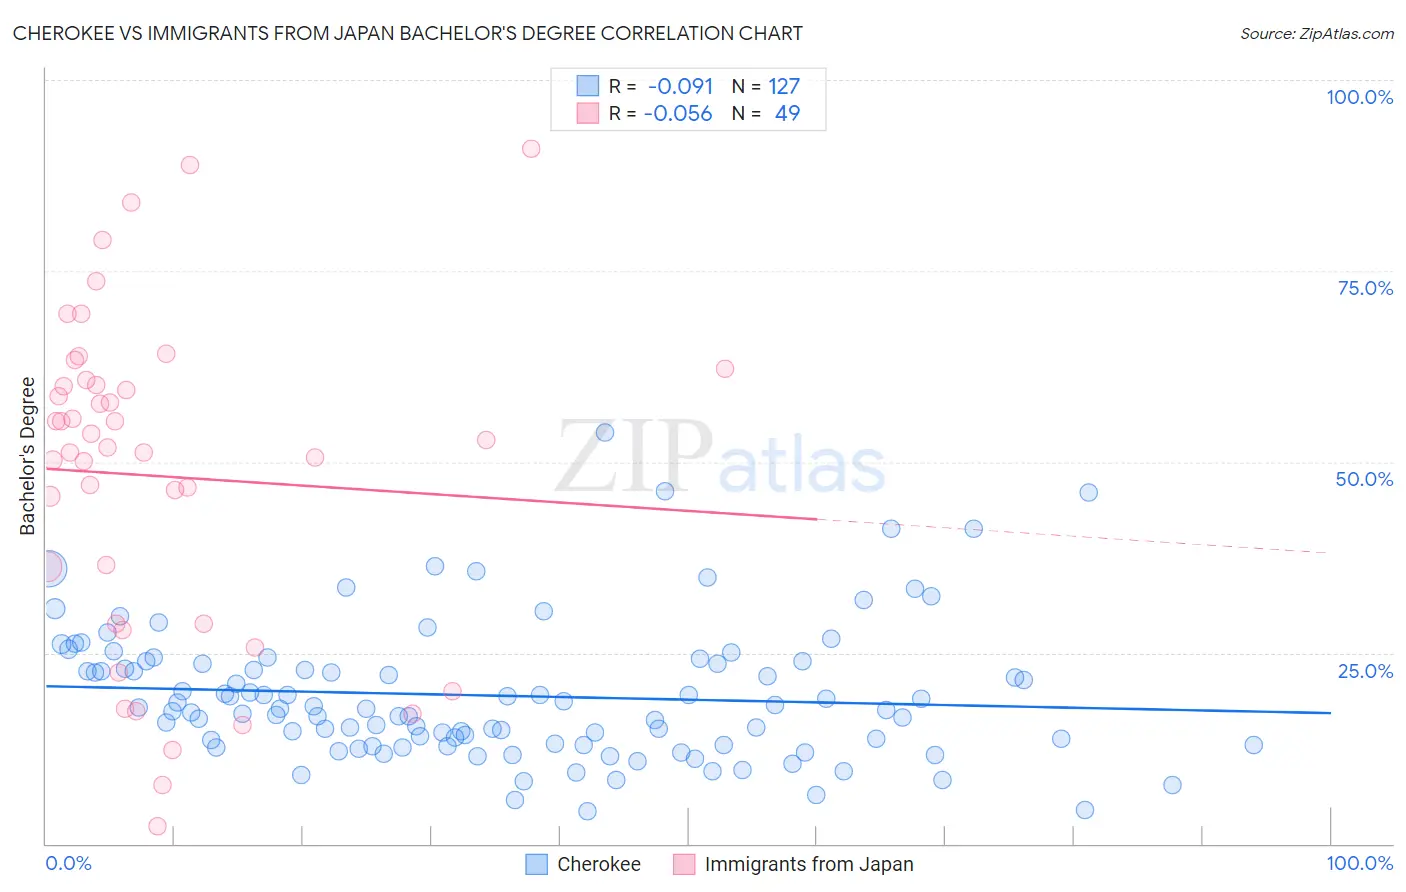
Cherokee vs Immigrants from Japan Bachelor's Degree Correlation Chart
The statistical analysis conducted on geographies consisting of 493,657,197 people shows a slight negative correlation between the proportion of Cherokee and percentage of population with at least bachelor's degree education in the United States with a correlation coefficient (R) of -0.091 and weighted average of 30.2%. Similarly, the statistical analysis conducted on geographies consisting of 340,124,195 people shows a slight negative correlation between the proportion of Immigrants from Japan and percentage of population with at least bachelor's degree education in the United States with a correlation coefficient (R) of -0.056 and weighted average of 46.8%, a difference of 55.1%.
Bachelor's Degree Correlation Summary
| Measurement | Cherokee | Immigrants from Japan |
| Minimum | 4.3% | 2.2% |
| Maximum | 53.8% | 91.0% |
| Range | 49.6% | 88.7% |
| Mean | 19.4% | 48.1% |
| Median | 17.6% | 51.9% |
| Interquartile 25% (IQ1) | 13.0% | 28.8% |
| Interquartile 75% (IQ3) | 23.6% | 60.4% |
| Interquartile Range (IQR) | 10.6% | 31.6% |
| Standard Deviation (Sample) | 8.9% | 21.3% |
| Standard Deviation (Population) | 8.8% | 21.1% |
Similar Demographics by Bachelor's Degree
Demographics Similar to Cherokee by Bachelor's Degree
In terms of bachelor's degree, the demographic groups most similar to Cherokee are Bangladeshi (30.2%, a difference of 0.010%), Mexican American Indian (30.2%, a difference of 0.17%), Immigrants from Latin America (30.1%, a difference of 0.42%), Immigrants from Cuba (30.3%, a difference of 0.45%), and Immigrants from Micronesia (30.4%, a difference of 0.67%).
| Demographics | Rating | Rank | Bachelor's Degree |
| Immigrants | Haiti | 0.0 /100 | #297 | Tragic 30.6% |
| Chippewa | 0.0 /100 | #298 | Tragic 30.6% |
| Chickasaw | 0.0 /100 | #299 | Tragic 30.4% |
| Immigrants | Micronesia | 0.0 /100 | #300 | Tragic 30.4% |
| Immigrants | Cuba | 0.0 /100 | #301 | Tragic 30.3% |
| Mexican American Indians | 0.0 /100 | #302 | Tragic 30.2% |
| Bangladeshis | 0.0 /100 | #303 | Tragic 30.2% |
| Cherokee | 0.0 /100 | #304 | Tragic 30.2% |
| Immigrants | Latin America | 0.0 /100 | #305 | Tragic 30.1% |
| Immigrants | Yemen | 0.0 /100 | #306 | Tragic 29.9% |
| Nepalese | 0.0 /100 | #307 | Tragic 29.9% |
| Cajuns | 0.0 /100 | #308 | Tragic 29.6% |
| Hispanics or Latinos | 0.0 /100 | #309 | Tragic 29.6% |
| Cheyenne | 0.0 /100 | #310 | Tragic 29.4% |
| Choctaw | 0.0 /100 | #311 | Tragic 29.4% |
Demographics Similar to Immigrants from Japan by Bachelor's Degree
In terms of bachelor's degree, the demographic groups most similar to Immigrants from Japan are Burmese (46.9%, a difference of 0.10%), Immigrants from Korea (47.0%, a difference of 0.33%), Immigrants from Sweden (47.0%, a difference of 0.37%), Immigrants from Belgium (47.0%, a difference of 0.46%), and Immigrants from Ireland (47.1%, a difference of 0.66%).
| Demographics | Rating | Rank | Bachelor's Degree |
| Cambodians | 100.0 /100 | #19 | Exceptional 47.2% |
| Immigrants | Switzerland | 100.0 /100 | #20 | Exceptional 47.1% |
| Immigrants | Ireland | 100.0 /100 | #21 | Exceptional 47.1% |
| Immigrants | Belgium | 100.0 /100 | #22 | Exceptional 47.0% |
| Immigrants | Sweden | 100.0 /100 | #23 | Exceptional 47.0% |
| Immigrants | Korea | 100.0 /100 | #24 | Exceptional 47.0% |
| Burmese | 100.0 /100 | #25 | Exceptional 46.9% |
| Immigrants | Japan | 100.0 /100 | #26 | Exceptional 46.8% |
| Immigrants | France | 100.0 /100 | #27 | Exceptional 46.4% |
| Turks | 100.0 /100 | #28 | Exceptional 46.2% |
| Israelis | 100.0 /100 | #29 | Exceptional 46.1% |
| Immigrants | Sri Lanka | 100.0 /100 | #30 | Exceptional 46.1% |
| Latvians | 100.0 /100 | #31 | Exceptional 46.1% |
| Immigrants | Turkey | 100.0 /100 | #32 | Exceptional 46.0% |
| Immigrants | Northern Europe | 100.0 /100 | #33 | Exceptional 45.6% |