Cherokee vs Pima Unemployment Among Ages 20 to 24 years
COMPARE
Cherokee
Pima
Unemployment Among Ages 20 to 24 years
Unemployment Among Ages 20 to 24 years Comparison
Cherokee
Pima
10.5%
UNEMPLOYMENT AMONG AGES 20 TO 24 YEARS
9.3/ 100
METRIC RATING
217th/ 347
METRIC RANK
14.2%
UNEMPLOYMENT AMONG AGES 20 TO 24 YEARS
0.0/ 100
METRIC RATING
336th/ 347
METRIC RANK
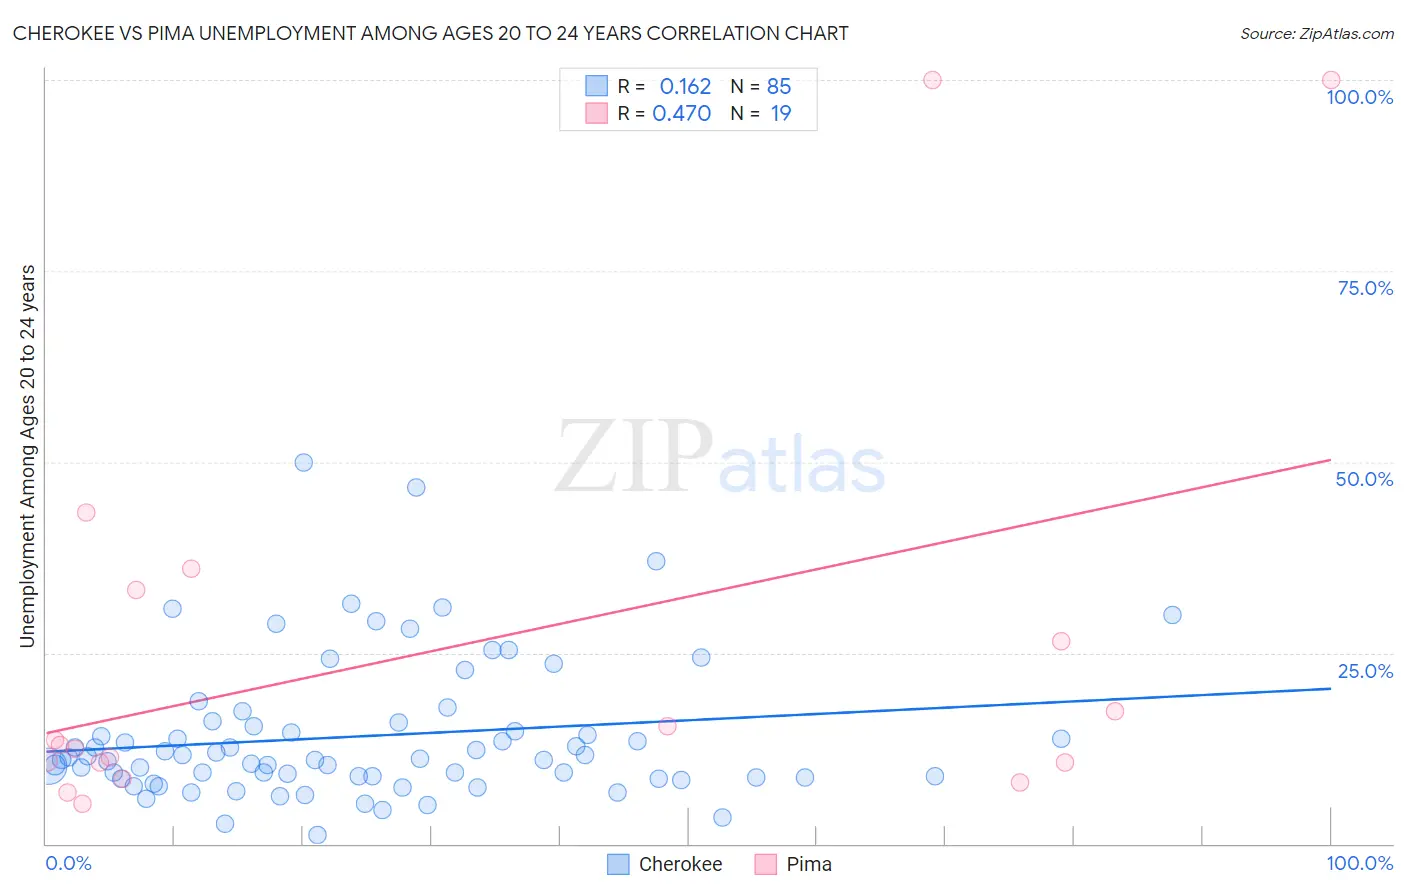
Cherokee vs Pima Unemployment Among Ages 20 to 24 years Correlation Chart
The statistical analysis conducted on geographies consisting of 466,012,066 people shows a poor positive correlation between the proportion of Cherokee and unemployment rate among population between the ages 20 and 24 in the United States with a correlation coefficient (R) of 0.162 and weighted average of 10.5%. Similarly, the statistical analysis conducted on geographies consisting of 61,107,514 people shows a moderate positive correlation between the proportion of Pima and unemployment rate among population between the ages 20 and 24 in the United States with a correlation coefficient (R) of 0.470 and weighted average of 14.2%, a difference of 34.9%.
Unemployment Among Ages 20 to 24 years Correlation Summary
| Measurement | Cherokee | Pima |
| Minimum | 1.2% | 5.2% |
| Maximum | 50.0% | 100.0% |
| Range | 48.8% | 94.8% |
| Mean | 14.1% | 25.4% |
| Median | 11.1% | 12.9% |
| Interquartile 25% (IQ1) | 8.6% | 10.6% |
| Interquartile 75% (IQ3) | 15.6% | 33.3% |
| Interquartile Range (IQR) | 7.0% | 22.7% |
| Standard Deviation (Sample) | 9.2% | 28.3% |
| Standard Deviation (Population) | 9.2% | 27.6% |
Similar Demographics by Unemployment Among Ages 20 to 24 years
Demographics Similar to Cherokee by Unemployment Among Ages 20 to 24 years
In terms of unemployment among ages 20 to 24 years, the demographic groups most similar to Cherokee are Costa Rican (10.5%, a difference of 0.030%), Nonimmigrants (10.5%, a difference of 0.060%), Honduran (10.5%, a difference of 0.12%), Immigrants from Southern Europe (10.5%, a difference of 0.15%), and Kiowa (10.5%, a difference of 0.23%).
| Demographics | Rating | Rank | Unemployment Among Ages 20 to 24 years |
| Immigrants | Belgium | 16.9 /100 | #210 | Poor 10.5% |
| Immigrants | Guatemala | 14.6 /100 | #211 | Poor 10.5% |
| Immigrants | Sri Lanka | 14.0 /100 | #212 | Poor 10.5% |
| Guatemalans | 12.2 /100 | #213 | Poor 10.5% |
| Kiowa | 11.7 /100 | #214 | Poor 10.5% |
| Hondurans | 10.5 /100 | #215 | Poor 10.5% |
| Costa Ricans | 9.6 /100 | #216 | Tragic 10.5% |
| Cherokee | 9.3 /100 | #217 | Tragic 10.5% |
| Immigrants | Nonimmigrants | 8.8 /100 | #218 | Tragic 10.5% |
| Immigrants | Southern Europe | 8.0 /100 | #219 | Tragic 10.5% |
| Eastern Europeans | 6.9 /100 | #220 | Tragic 10.6% |
| Central Americans | 6.8 /100 | #221 | Tragic 10.6% |
| Immigrants | Poland | 6.4 /100 | #222 | Tragic 10.6% |
| Arabs | 5.6 /100 | #223 | Tragic 10.6% |
| Nepalese | 5.1 /100 | #224 | Tragic 10.6% |
Demographics Similar to Pima by Unemployment Among Ages 20 to 24 years
In terms of unemployment among ages 20 to 24 years, the demographic groups most similar to Pima are Sioux (14.2%, a difference of 0.21%), Paiute (14.3%, a difference of 1.1%), Immigrants from St. Vincent and the Grenadines (14.3%, a difference of 1.1%), Guyanese (14.0%, a difference of 1.4%), and Immigrants from Guyana (13.9%, a difference of 1.9%).
| Demographics | Rating | Rank | Unemployment Among Ages 20 to 24 years |
| Dominicans | 0.0 /100 | #329 | Tragic 13.8% |
| Arapaho | 0.0 /100 | #330 | Tragic 13.8% |
| Aleuts | 0.0 /100 | #331 | Tragic 13.8% |
| Immigrants | Grenada | 0.0 /100 | #332 | Tragic 13.8% |
| Immigrants | Guyana | 0.0 /100 | #333 | Tragic 13.9% |
| Guyanese | 0.0 /100 | #334 | Tragic 14.0% |
| Sioux | 0.0 /100 | #335 | Tragic 14.2% |
| Pima | 0.0 /100 | #336 | Tragic 14.2% |
| Paiute | 0.0 /100 | #337 | Tragic 14.3% |
| Immigrants | St. Vincent and the Grenadines | 0.0 /100 | #338 | Tragic 14.3% |
| Immigrants | Yemen | 0.0 /100 | #339 | Tragic 14.9% |
| Yuman | 0.0 /100 | #340 | Tragic 15.8% |
| Navajo | 0.0 /100 | #341 | Tragic 16.1% |
| Puerto Ricans | 0.0 /100 | #342 | Tragic 16.7% |
| Tsimshian | 0.0 /100 | #343 | Tragic 18.0% |