Immigrants from Serbia vs Pima Bachelor's Degree
COMPARE
Immigrants from Serbia
Pima
Bachelor's Degree
Bachelor's Degree Comparison
Immigrants from Serbia
Pima
44.1%
BACHELOR'S DEGREE
99.9/ 100
METRIC RATING
56th/ 347
METRIC RANK
23.2%
BACHELOR'S DEGREE
0.0/ 100
METRIC RATING
345th/ 347
METRIC RANK
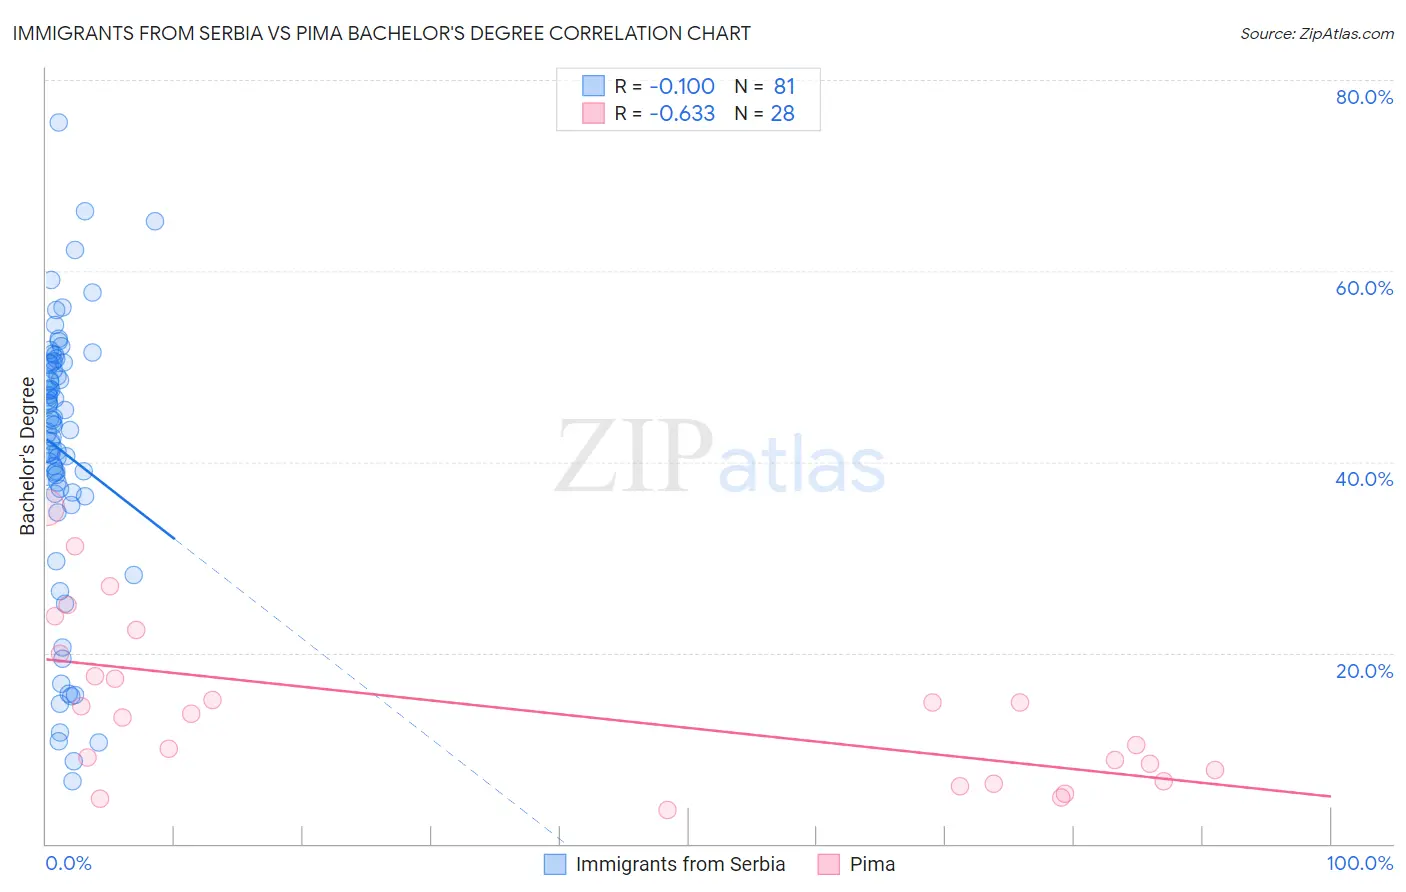
Immigrants from Serbia vs Pima Bachelor's Degree Correlation Chart
The statistical analysis conducted on geographies consisting of 131,744,029 people shows a poor negative correlation between the proportion of Immigrants from Serbia and percentage of population with at least bachelor's degree education in the United States with a correlation coefficient (R) of -0.100 and weighted average of 44.1%. Similarly, the statistical analysis conducted on geographies consisting of 61,550,117 people shows a significant negative correlation between the proportion of Pima and percentage of population with at least bachelor's degree education in the United States with a correlation coefficient (R) of -0.633 and weighted average of 23.2%, a difference of 90.1%.
Bachelor's Degree Correlation Summary
| Measurement | Immigrants from Serbia | Pima |
| Minimum | 6.6% | 3.5% |
| Maximum | 75.5% | 35.2% |
| Range | 69.0% | 31.6% |
| Mean | 41.1% | 14.2% |
| Median | 44.0% | 13.4% |
| Interquartile 25% (IQ1) | 36.7% | 7.1% |
| Interquartile 75% (IQ3) | 50.4% | 18.7% |
| Interquartile Range (IQR) | 13.6% | 11.6% |
| Standard Deviation (Sample) | 14.2% | 8.5% |
| Standard Deviation (Population) | 14.1% | 8.3% |
Similar Demographics by Bachelor's Degree
Demographics Similar to Immigrants from Serbia by Bachelor's Degree
In terms of bachelor's degree, the demographic groups most similar to Immigrants from Serbia are Immigrants from Bolivia (44.2%, a difference of 0.18%), Immigrants from Austria (44.2%, a difference of 0.19%), Paraguayan (44.0%, a difference of 0.19%), Immigrants from Czechoslovakia (44.0%, a difference of 0.24%), and Australian (44.0%, a difference of 0.34%).
| Demographics | Rating | Rank | Bachelor's Degree |
| Immigrants | Norway | 99.9 /100 | #49 | Exceptional 44.5% |
| Immigrants | Greece | 99.9 /100 | #50 | Exceptional 44.5% |
| Asians | 99.9 /100 | #51 | Exceptional 44.4% |
| Immigrants | Spain | 99.9 /100 | #52 | Exceptional 44.3% |
| Immigrants | Asia | 99.9 /100 | #53 | Exceptional 44.3% |
| Immigrants | Austria | 99.9 /100 | #54 | Exceptional 44.2% |
| Immigrants | Bolivia | 99.9 /100 | #55 | Exceptional 44.2% |
| Immigrants | Serbia | 99.9 /100 | #56 | Exceptional 44.1% |
| Paraguayans | 99.9 /100 | #57 | Exceptional 44.0% |
| Immigrants | Czechoslovakia | 99.9 /100 | #58 | Exceptional 44.0% |
| Australians | 99.9 /100 | #59 | Exceptional 44.0% |
| New Zealanders | 99.9 /100 | #60 | Exceptional 44.0% |
| South Africans | 99.8 /100 | #61 | Exceptional 43.6% |
| Immigrants | Kazakhstan | 99.8 /100 | #62 | Exceptional 43.4% |
| Immigrants | Europe | 99.8 /100 | #63 | Exceptional 43.4% |
Demographics Similar to Pima by Bachelor's Degree
In terms of bachelor's degree, the demographic groups most similar to Pima are Navajo (23.6%, a difference of 1.8%), Tohono O'odham (24.4%, a difference of 5.2%), Yakama (24.5%, a difference of 5.4%), Yuman (24.5%, a difference of 5.7%), and Lumbee (24.8%, a difference of 6.7%).
| Demographics | Rating | Rank | Bachelor's Degree |
| Mexicans | 0.0 /100 | #333 | Tragic 27.1% |
| Arapaho | 0.0 /100 | #334 | Tragic 26.6% |
| Natives/Alaskans | 0.0 /100 | #335 | Tragic 26.3% |
| Immigrants | Mexico | 0.0 /100 | #336 | Tragic 26.1% |
| Inupiat | 0.0 /100 | #337 | Tragic 25.8% |
| Pueblo | 0.0 /100 | #338 | Tragic 25.5% |
| Hopi | 0.0 /100 | #339 | Tragic 25.3% |
| Lumbee | 0.0 /100 | #340 | Tragic 24.8% |
| Yuman | 0.0 /100 | #341 | Tragic 24.5% |
| Yakama | 0.0 /100 | #342 | Tragic 24.5% |
| Tohono O'odham | 0.0 /100 | #343 | Tragic 24.4% |
| Navajo | 0.0 /100 | #344 | Tragic 23.6% |
| Pima | 0.0 /100 | #345 | Tragic 23.2% |
| Houma | 0.0 /100 | #346 | Tragic 21.4% |
| Yup'ik | 0.0 /100 | #347 | Tragic 19.4% |