Central American vs Menominee Householder Income Under 25 years

COMPARE

Central American
Race
Ancestry
AfghanAfricanAlaska NativeAlaskan AthabascanAlbanianAleutAlsatianAmericanApacheArabArapahoArgentineanArmenianAssyrian/Chaldean/SyriacAustralianAustrianBahamianBangladeshiBarbadianBasqueBelgianBelizeanBermudanBhutaneseBlackfeetBolivianBrazilianBritishBritish West IndianBulgarianBurmeseCajunCambodianCanadianCape VerdeanCarpatho RusynCelticCentral AmericanCentral American IndianCherokeeCheyenneChickasawChileanChineseChippewaChoctawColombianColvilleComancheCosta RicanCreeCreekCroatianCrowCubanCypriotCzechCzechoslovakianDanishDelawareDominicanDutchDutch West IndianEastern EuropeanEcuadorianEgyptianEnglishEstonianEthiopianEuropeanFijianFilipinoFinnishFrenchFrench American IndianFrench CanadianGermanGerman RussianGhanaianGreekGuamanian/ChamorroGuatemalanGuyaneseHaitianHmongHonduranHopiHoumaHungarianIcelanderIndian (Asian)IndonesianInupiatIranianIraqiIrishIroquoisIsraeliItalianJamaicanJapaneseJordanianKenyanKiowaKoreanLaotianLatvianLebaneseLiberianLithuanianLumbeeLuxembourgerMacedonianMalaysianMalteseMarshalleseMexicanMexican American IndianMongolianMoroccanNative HawaiianNavajoNepaleseNew ZealanderNicaraguanNigerianNorthern EuropeanNorwegianOkinawanOsageOttawaPaiutePakistaniPalestinianPanamanianParaguayanPennsylvania GermanPeruvianPimaPolishPortuguesePotawatomiPuebloPuerto RicanPuget Sound SalishRomanianRussianSalvadoranSamoanScandinavianScotch-IrishScottishSeminoleSenegaleseSerbianShoshoneSierra LeoneanSiouxSlavicSlovakSloveneSomaliSouth AfricanSouth AmericanSouth American IndianSoviet UnionSpaniardSpanishSpanish AmericanSpanish American IndianSri LankanSubsaharan AfricanSudaneseSwedishSwissSyrianTaiwaneseThaiTlingit-HaidaTohono O'OdhamTonganTrinidadian and TobagonianTsimshianTurkishU.S. Virgin IslanderUgandanUkrainianUruguayanUteVenezuelanVietnameseWelshWest IndianYakamaYaquiYugoslavianYumanYup'ikZimbabwean
Immigration
NonimmigrantsImmigrantsAfghanistanAfricaAlbaniaArgentinaArmeniaAsiaAustraliaAustriaBahamasBangladeshBarbadosBelarusBelgiumBelizeBoliviaBosnia and HerzegovinaBrazilBulgariaBurma/MyanmarCabo VerdeCambodiaCameroonCanadaCaribbeanCentral AmericaChileChinaColombiaCongoCosta RicaCroatiaCubaCzechoslovakiaDenmarkDominicaDominican RepublicEastern AfricaEastern AsiaEastern EuropeEcuadorEgyptEl SalvadorEnglandEritreaEthiopiaEuropeFijiFranceGermanyGhanaGreeceGrenadaGuatemalaGuyanaHaitiHondurasHong KongHungaryIndiaIndonesiaIranIraqIrelandIsraelItalyJamaicaJapanJordanKazakhstanKenyaKoreaKuwaitLaosLatin AmericaLatviaLebanonLiberiaLithuaniaMalaysiaMexicoMicronesiaMiddle AfricaMoldovaMoroccoNepalNetherlandsNicaraguaNigeriaNorth AmericaNorth MacedoniaNorthern AfricaNorthern EuropeNorwayOceaniaPakistanPanamaPeruPhilippinesPolandPortugalRomaniaRussiaSaudi ArabiaScotlandSenegalSerbiaSierra LeoneSingaporeSomaliaSouth AfricaSouth AmericaSouth Central AsiaSouth Eastern AsiaSouthern EuropeSpainSri LankaSt. Vincent and the GrenadinesSudanSwedenSwitzerlandSyriaTaiwanThailandTrinidad and TobagoTurkeyUgandaUkraineUruguayUzbekistanVenezuelaVietnamWest IndiesWestern AfricaWestern AsiaWestern EuropeYemenZaireZimbabweAzores
Menominee
Race
Ancestry
AfghanAfricanAlaska NativeAlaskan AthabascanAlbanianAleutAlsatianAmericanApacheArabArapahoArgentineanArmenianAssyrian/Chaldean/SyriacAustralianAustrianBahamianBangladeshiBarbadianBasqueBelgianBelizeanBermudanBhutaneseBlackfeetBolivianBrazilianBritishBritish West IndianBulgarianBurmeseCajunCambodianCanadianCape VerdeanCarpatho RusynCelticCentral American IndianCherokeeCheyenneChickasawChileanChineseChippewaChoctawColombianColvilleComancheCosta RicanCreeCreekCroatianCrowCubanCypriotCzechCzechoslovakianDanishDelawareDominicanDutchDutch West IndianEastern EuropeanEcuadorianEgyptianEnglishEstonianEthiopianEuropeanFijianFilipinoFinnishFrenchFrench American IndianFrench CanadianGermanGerman RussianGhanaianGreekGuamanian/ChamorroGuatemalanGuyaneseHaitianHmongHonduranHopiHoumaHungarianIcelanderIndian (Asian)IndonesianInupiatIranianIraqiIrishIroquoisIsraeliItalianJamaicanJapaneseJordanianKenyanKiowaKoreanLaotianLatvianLebaneseLiberianLithuanianLumbeeLuxembourgerMacedonianMalaysianMalteseMarshalleseMenomineeMexicanMexican American IndianMongolianMoroccanNative HawaiianNavajoNepaleseNew ZealanderNicaraguanNigerianNorthern EuropeanNorwegianOkinawanOsageOttawaPaiutePakistaniPalestinianPanamanianParaguayanPennsylvania GermanPeruvianPimaPolishPortuguesePotawatomiPuebloPuerto RicanPuget Sound SalishRomanianRussianSalvadoranSamoanScandinavianScotch-IrishScottishSeminoleSenegaleseSerbianShoshoneSierra LeoneanSiouxSlavicSlovakSloveneSomaliSouth AfricanSouth AmericanSouth American IndianSoviet UnionSpaniardSpanishSpanish AmericanSpanish American IndianSri LankanSubsaharan AfricanSudaneseSwedishSwissSyrianTaiwaneseThaiTlingit-HaidaTohono O'OdhamTonganTrinidadian and TobagonianTsimshianTurkishU.S. Virgin IslanderUgandanUkrainianUruguayanUteVenezuelanVietnameseWelshWest IndianYakamaYaquiYugoslavianYumanYup'ikZimbabwean
Immigration
NonimmigrantsImmigrantsAfghanistanAfricaAlbaniaArgentinaArmeniaAsiaAustraliaAustriaBahamasBangladeshBarbadosBelarusBelgiumBelizeBoliviaBosnia and HerzegovinaBrazilBulgariaBurma/MyanmarCabo VerdeCambodiaCameroonCanadaCaribbeanCentral AmericaChileChinaColombiaCongoCosta RicaCroatiaCubaCzechoslovakiaDenmarkDominicaDominican RepublicEastern AfricaEastern AsiaEastern EuropeEcuadorEgyptEl SalvadorEnglandEritreaEthiopiaEuropeFijiFranceGermanyGhanaGreeceGrenadaGuatemalaGuyanaHaitiHondurasHong KongHungaryIndiaIndonesiaIranIraqIrelandIsraelItalyJamaicaJapanJordanKazakhstanKenyaKoreaKuwaitLaosLatin AmericaLatviaLebanonLiberiaLithuaniaMalaysiaMexicoMicronesiaMiddle AfricaMoldovaMoroccoNepalNetherlandsNicaraguaNigeriaNorth AmericaNorth MacedoniaNorthern AfricaNorthern EuropeNorwayOceaniaPakistanPanamaPeruPhilippinesPolandPortugalRomaniaRussiaSaudi ArabiaScotlandSenegalSerbiaSierra LeoneSingaporeSomaliaSouth AfricaSouth AmericaSouth Central AsiaSouth Eastern AsiaSouthern EuropeSpainSri LankaSt. Vincent and the GrenadinesSudanSwedenSwitzerlandSyriaTaiwanThailandTrinidad and TobagoTurkeyUgandaUkraineUruguayUzbekistanVenezuelaVietnamWest IndiesWestern AfricaWestern AsiaWestern EuropeYemenZaireZimbabweAzores
Householder Income Under 25 years
Income
Poverty
Unemployment
Labor Participation
Family Structure
Vehicle Availability
Education Level
Disability

Householder Income Under 25 years Comparison

Central Americans

Menominee

Good
Tragic
$52,626
HOUSEHOLDER INCOME UNDER 25 YEARS
74.4/ 100
METRIC RATING
153rd/ 347
METRIC RANK
$47,907
HOUSEHOLDER INCOME UNDER 25 YEARS
0.0/ 100
METRIC RATING
304th/ 347
METRIC RANK

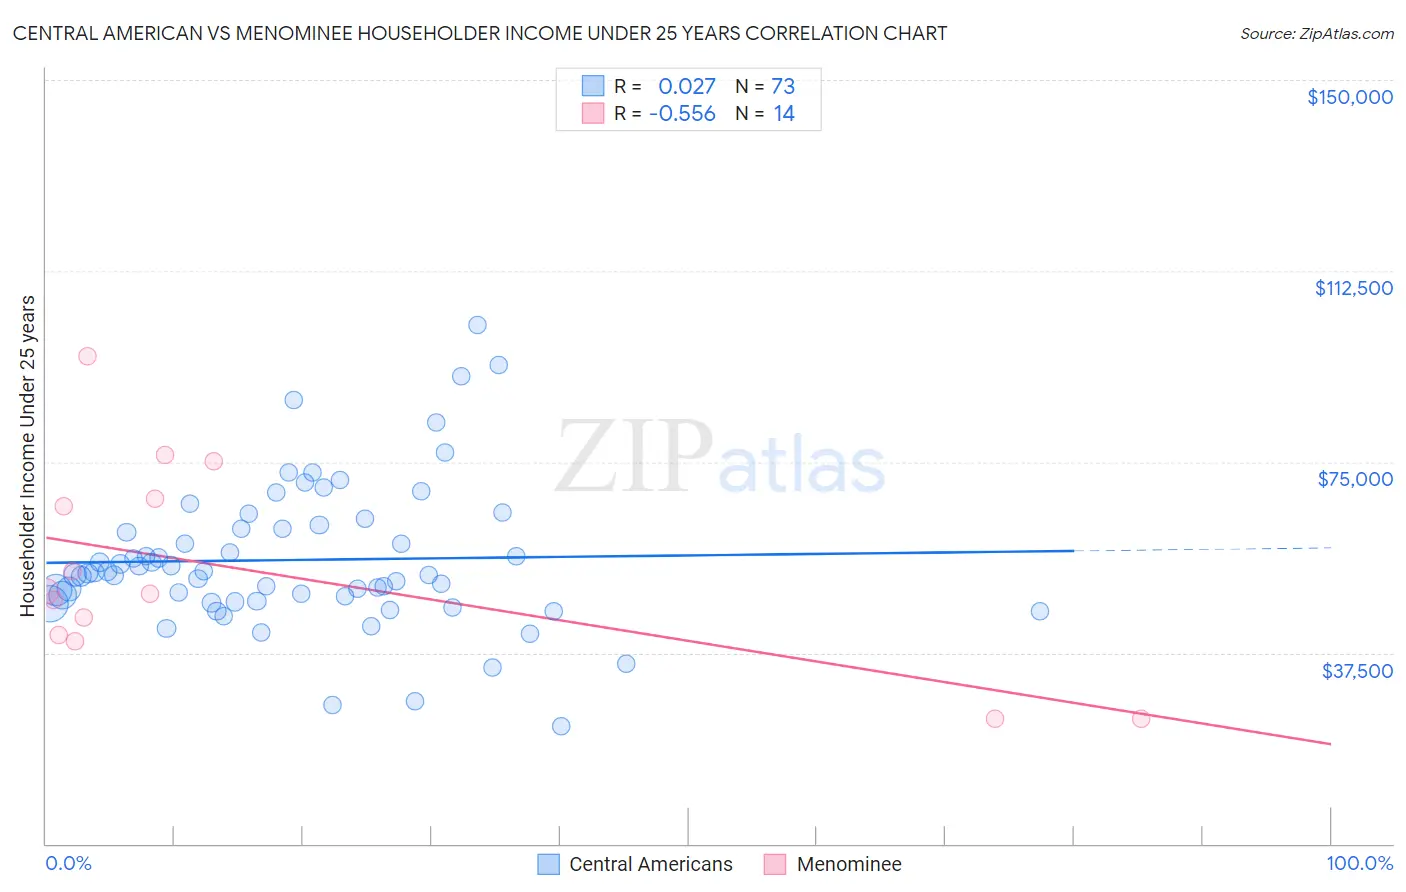
Central American vs Menominee Householder Income Under 25 years Correlation Chart

The statistical analysis conducted on geographies consisting of 409,880,341 people shows no correlation between the proportion of Central Americans and household income with householder under the age of 25 in the United States with a correlation coefficient (R) of 0.027 and weighted average of $52,626. Similarly, the statistical analysis conducted on geographies consisting of 44,234,460 people shows a substantial negative correlation between the proportion of Menominee and household income with householder under the age of 25 in the United States with a correlation coefficient (R) of -0.556 and weighted average of $47,907, a difference of 9.9%.
Central American vs Menominee Householder Income Under 25 years

Householder Income Under 25 years Correlation Summary

MeasurementCentral AmericanMenominee
Minimum$23,070$24,615
Maximum$101,774$95,833
Range$78,704$71,218
Mean$55,733$53,984
Median$53,095$49,327
Interquartile 25% (IQ1)$47,526$41,044
Interquartile 75% (IQ3)$62,172$67,708
Interquartile Range (IQR)$14,646$26,664
Standard Deviation (Sample)$14,360$20,193
Standard Deviation (Population)$14,261$19,458

Similar Demographics by Householder Income Under 25 years

Demographics Similar to Central Americans by Householder Income Under 25 years

In terms of householder income under 25 years, the demographic groups most similar to Central Americans are Trinidadian and Tobagonian ($52,631, a difference of 0.010%), Immigrants from the Azores ($52,621, a difference of 0.010%), Immigrants from Scotland ($52,638, a difference of 0.020%), Immigrants from Costa Rica ($52,643, a difference of 0.030%), and Immigrants from Denmark ($52,612, a difference of 0.030%).
DemographicsRating | RankHouseholder Income Under 25 years
Immigrants | Hungary
81.6
/100
|
#146
Excellent
$52,798
Latvians
81.0
/100
|
#147
Excellent
$52,783
French Canadians
76.5
/100
|
#148
Good
$52,672
Scandinavians
75.7
/100
|
#149
Good
$52,654
Immigrants | Costa Rica
75.2
/100
|
#150
Good
$52,643
Immigrants | Scotland
75.0
/100
|
#151
Good
$52,638
Trinidadians and Tobagonians
74.6
/100
|
#152
Good
$52,631
Central Americans
74.4
/100
|
#153
Good
$52,626
Immigrants | Azores
74.2
/100
|
#154
Good
$52,621
Immigrants | Denmark
73.8
/100
|
#155
Good
$52,612
Immigrants | Nepal
73.7
/100
|
#156
Good
$52,611
Ghanaians
72.9
/100
|
#157
Good
$52,594
Immigrants | Netherlands
72.8
/100
|
#158
Good
$52,592
Mongolians
70.2
/100
|
#159
Good
$52,540
Immigrants | Turkey
68.3
/100
|
#160
Good
$52,503

Demographics Similar to Menominee by Householder Income Under 25 years

In terms of householder income under 25 years, the demographic groups most similar to Menominee are Immigrants from Middle Africa ($47,916, a difference of 0.020%), Cherokee ($47,848, a difference of 0.12%), Immigrants from Liberia ($47,981, a difference of 0.15%), Native/Alaskan ($47,704, a difference of 0.43%), and Immigrants from Kuwait ($48,126, a difference of 0.46%).
DemographicsRating | RankHouseholder Income Under 25 years
Cree
0.0
/100
|
#297
Tragic
$48,514
Yaqui
0.0
/100
|
#298
Tragic
$48,300
Immigrants | Honduras
0.0
/100
|
#299
Tragic
$48,267
Immigrants | Somalia
0.0
/100
|
#300
Tragic
$48,135
Immigrants | Kuwait
0.0
/100
|
#301
Tragic
$48,126
Immigrants | Liberia
0.0
/100
|
#302
Tragic
$47,981
Immigrants | Middle Africa
0.0
/100
|
#303
Tragic
$47,916
Menominee
0.0
/100
|
#304
Tragic
$47,907
Cherokee
0.0
/100
|
#305
Tragic
$47,848
Natives/Alaskans
0.0
/100
|
#306
Tragic
$47,704
Bangladeshis
0.0
/100
|
#307
Tragic
$47,589
Comanche
0.0
/100
|
#308
Tragic
$47,518
U.S. Virgin Islanders
0.0
/100
|
#309
Tragic
$47,448
Iroquois
0.0
/100
|
#310
Tragic
$47,380
Ottawa
0.0
/100
|
#311
Tragic
$47,366