Central American vs Comanche GED/Equivalency
COMPARE
Central American
Comanche
GED/Equivalency
GED/Equivalency Comparison
Central Americans
Comanche
79.2%
GED/EQUIVALENCY
0.0/ 100
METRIC RATING
327th/ 347
METRIC RANK
83.6%
GED/EQUIVALENCY
0.7/ 100
METRIC RATING
253rd/ 347
METRIC RANK
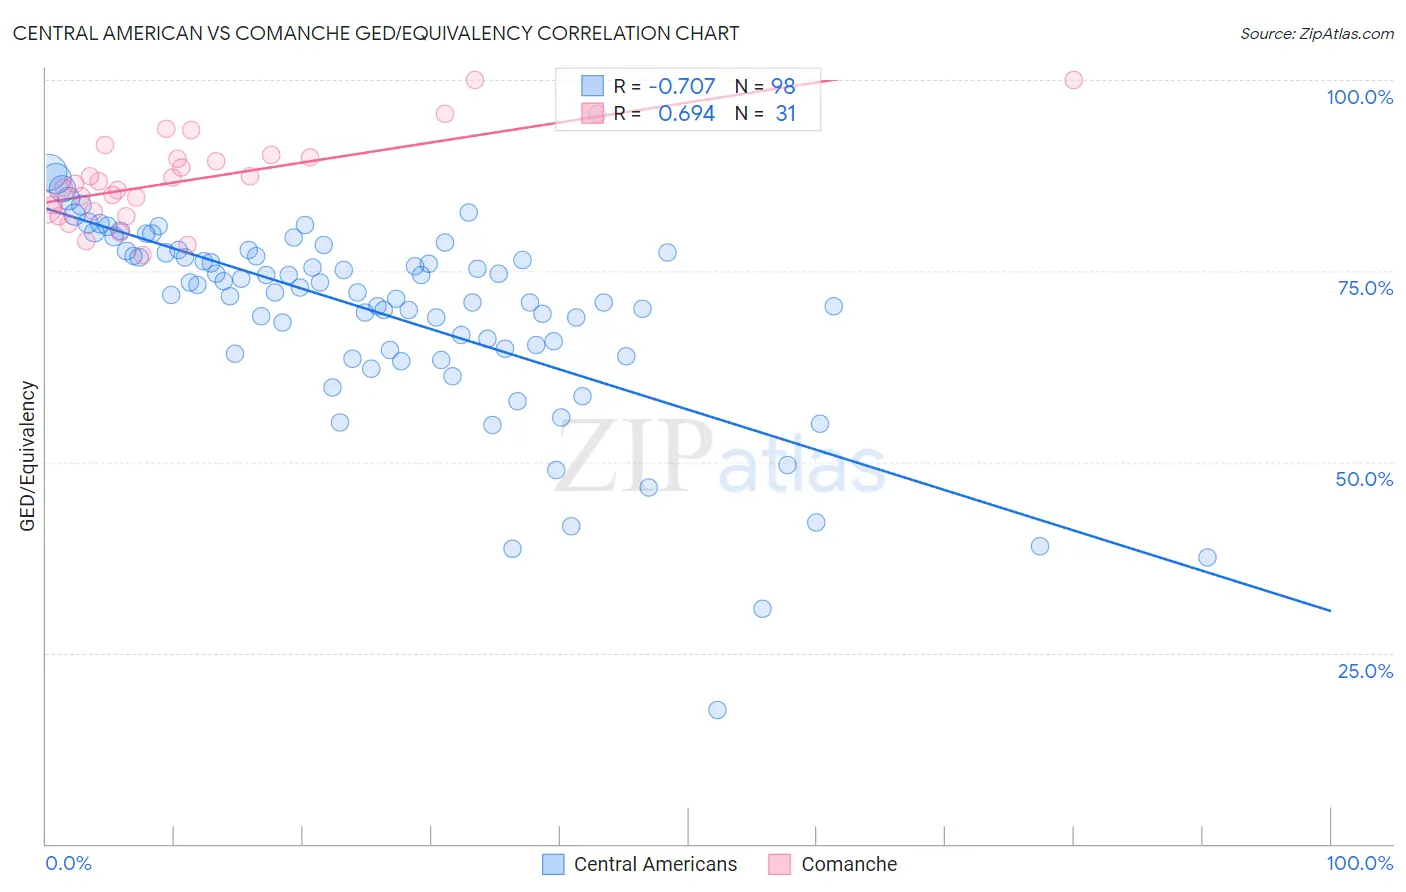
Central American vs Comanche GED/Equivalency Correlation Chart
The statistical analysis conducted on geographies consisting of 504,618,995 people shows a strong negative correlation between the proportion of Central Americans and percentage of population with at least ged/equivalency education in the United States with a correlation coefficient (R) of -0.707 and weighted average of 79.2%. Similarly, the statistical analysis conducted on geographies consisting of 109,786,530 people shows a significant positive correlation between the proportion of Comanche and percentage of population with at least ged/equivalency education in the United States with a correlation coefficient (R) of 0.694 and weighted average of 83.6%, a difference of 5.6%.
GED/Equivalency Correlation Summary
| Measurement | Central American | Comanche |
| Minimum | 17.6% | 77.0% |
| Maximum | 95.6% | 100.0% |
| Range | 78.0% | 23.0% |
| Mean | 69.4% | 86.9% |
| Median | 72.5% | 86.4% |
| Interquartile 25% (IQ1) | 64.6% | 82.8% |
| Interquartile 75% (IQ3) | 77.4% | 89.8% |
| Interquartile Range (IQR) | 12.8% | 7.1% |
| Standard Deviation (Sample) | 13.0% | 5.7% |
| Standard Deviation (Population) | 13.0% | 5.6% |
Similar Demographics by GED/Equivalency
Demographics Similar to Central Americans by GED/Equivalency
In terms of ged/equivalency, the demographic groups most similar to Central Americans are Yuman (79.2%, a difference of 0.020%), Hispanic or Latino (79.1%, a difference of 0.10%), Honduran (79.3%, a difference of 0.11%), Dominican (79.1%, a difference of 0.15%), and Mexican American Indian (79.4%, a difference of 0.23%).
| Demographics | Rating | Rank | GED/Equivalency |
| Immigrants | Cuba | 0.0 /100 | #320 | Tragic 80.2% |
| Yup'ik | 0.0 /100 | #321 | Tragic 80.0% |
| Lumbee | 0.0 /100 | #322 | Tragic 80.0% |
| Immigrants | Nicaragua | 0.0 /100 | #323 | Tragic 79.9% |
| Mexican American Indians | 0.0 /100 | #324 | Tragic 79.4% |
| Hondurans | 0.0 /100 | #325 | Tragic 79.3% |
| Yuman | 0.0 /100 | #326 | Tragic 79.2% |
| Central Americans | 0.0 /100 | #327 | Tragic 79.2% |
| Hispanics or Latinos | 0.0 /100 | #328 | Tragic 79.1% |
| Dominicans | 0.0 /100 | #329 | Tragic 79.1% |
| Immigrants | Cabo Verde | 0.0 /100 | #330 | Tragic 78.9% |
| Immigrants | Honduras | 0.0 /100 | #331 | Tragic 78.7% |
| Immigrants | Azores | 0.0 /100 | #332 | Tragic 78.7% |
| Salvadorans | 0.0 /100 | #333 | Tragic 78.6% |
| Guatemalans | 0.0 /100 | #334 | Tragic 78.5% |
Demographics Similar to Comanche by GED/Equivalency
In terms of ged/equivalency, the demographic groups most similar to Comanche are Creek (83.6%, a difference of 0.030%), Spanish American (83.6%, a difference of 0.060%), Bahamian (83.6%, a difference of 0.060%), Colville (83.4%, a difference of 0.20%), and African (83.4%, a difference of 0.20%).
| Demographics | Rating | Rank | GED/Equivalency |
| Chickasaw | 1.2 /100 | #246 | Tragic 83.8% |
| Immigrants | Western Africa | 1.1 /100 | #247 | Tragic 83.8% |
| Blackfeet | 1.1 /100 | #248 | Tragic 83.8% |
| Crow | 1.1 /100 | #249 | Tragic 83.8% |
| Shoshone | 1.0 /100 | #250 | Tragic 83.7% |
| Spanish Americans | 0.8 /100 | #251 | Tragic 83.6% |
| Bahamians | 0.8 /100 | #252 | Tragic 83.6% |
| Comanche | 0.7 /100 | #253 | Tragic 83.6% |
| Creek | 0.7 /100 | #254 | Tragic 83.6% |
| Colville | 0.5 /100 | #255 | Tragic 83.4% |
| Africans | 0.5 /100 | #256 | Tragic 83.4% |
| Jamaicans | 0.4 /100 | #257 | Tragic 83.3% |
| Malaysians | 0.4 /100 | #258 | Tragic 83.3% |
| Immigrants | Vietnam | 0.3 /100 | #259 | Tragic 83.2% |
| Choctaw | 0.3 /100 | #260 | Tragic 83.1% |