Central American vs Immigrants from Denmark Master's Degree
COMPARE
Central American
Immigrants from Denmark
Master's Degree
Master's Degree Comparison
Central Americans
Immigrants from Denmark
12.2%
MASTER'S DEGREE
0.3/ 100
METRIC RATING
269th/ 347
METRIC RANK
19.5%
MASTER'S DEGREE
100.0/ 100
METRIC RATING
34th/ 347
METRIC RANK
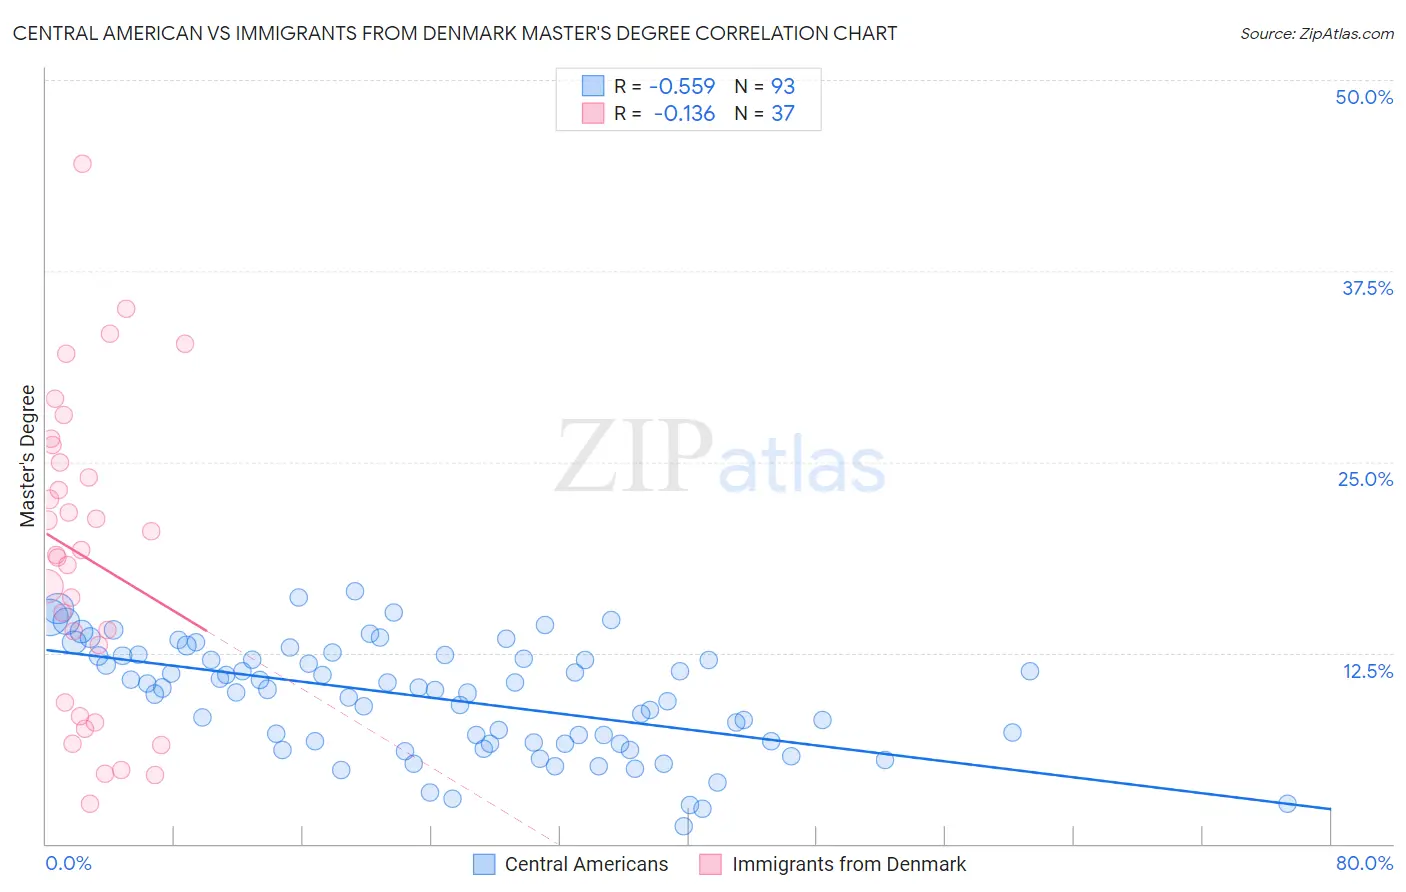
Central American vs Immigrants from Denmark Master's Degree Correlation Chart
The statistical analysis conducted on geographies consisting of 504,206,003 people shows a substantial negative correlation between the proportion of Central Americans and percentage of population with at least master's degree education in the United States with a correlation coefficient (R) of -0.559 and weighted average of 12.2%. Similarly, the statistical analysis conducted on geographies consisting of 136,426,829 people shows a poor negative correlation between the proportion of Immigrants from Denmark and percentage of population with at least master's degree education in the United States with a correlation coefficient (R) of -0.136 and weighted average of 19.5%, a difference of 60.3%.
Master's Degree Correlation Summary
| Measurement | Central American | Immigrants from Denmark |
| Minimum | 1.1% | 2.7% |
| Maximum | 16.6% | 44.5% |
| Range | 15.4% | 41.9% |
| Mean | 9.5% | 18.7% |
| Median | 10.1% | 18.9% |
| Interquartile 25% (IQ1) | 6.6% | 8.8% |
| Interquartile 75% (IQ3) | 12.3% | 25.5% |
| Interquartile Range (IQR) | 5.7% | 16.7% |
| Standard Deviation (Sample) | 3.6% | 10.1% |
| Standard Deviation (Population) | 3.6% | 9.9% |
Similar Demographics by Master's Degree
Demographics Similar to Central Americans by Master's Degree
In terms of master's degree, the demographic groups most similar to Central Americans are Salvadoran (12.2%, a difference of 0.13%), Native Hawaiian (12.3%, a difference of 0.65%), Haitian (12.1%, a difference of 0.72%), Comanche (12.1%, a difference of 0.78%), and Blackfeet (12.1%, a difference of 0.87%).
| Demographics | Rating | Rank | Master's Degree |
| Nicaraguans | 0.6 /100 | #262 | Tragic 12.5% |
| Central American Indians | 0.5 /100 | #263 | Tragic 12.4% |
| Belizeans | 0.5 /100 | #264 | Tragic 12.4% |
| Immigrants | Fiji | 0.5 /100 | #265 | Tragic 12.4% |
| Bahamians | 0.5 /100 | #266 | Tragic 12.4% |
| Americans | 0.4 /100 | #267 | Tragic 12.3% |
| Native Hawaiians | 0.4 /100 | #268 | Tragic 12.3% |
| Central Americans | 0.3 /100 | #269 | Tragic 12.2% |
| Salvadorans | 0.3 /100 | #270 | Tragic 12.2% |
| Haitians | 0.3 /100 | #271 | Tragic 12.1% |
| Comanche | 0.3 /100 | #272 | Tragic 12.1% |
| Blackfeet | 0.3 /100 | #273 | Tragic 12.1% |
| Cape Verdeans | 0.3 /100 | #274 | Tragic 12.1% |
| Cubans | 0.3 /100 | #275 | Tragic 12.1% |
| Blacks/African Americans | 0.3 /100 | #276 | Tragic 12.1% |
Demographics Similar to Immigrants from Denmark by Master's Degree
In terms of master's degree, the demographic groups most similar to Immigrants from Denmark are Russian (19.5%, a difference of 0.030%), Immigrants from Northern Europe (19.5%, a difference of 0.33%), Immigrants from Russia (19.4%, a difference of 0.70%), Mongolian (19.4%, a difference of 0.74%), and Burmese (19.7%, a difference of 0.81%).
| Demographics | Rating | Rank | Master's Degree |
| Immigrants | Sri Lanka | 100.0 /100 | #27 | Exceptional 19.9% |
| Turks | 100.0 /100 | #28 | Exceptional 19.9% |
| Latvians | 100.0 /100 | #29 | Exceptional 19.8% |
| Immigrants | Turkey | 100.0 /100 | #30 | Exceptional 19.7% |
| Immigrants | Korea | 100.0 /100 | #31 | Exceptional 19.7% |
| Burmese | 100.0 /100 | #32 | Exceptional 19.7% |
| Russians | 100.0 /100 | #33 | Exceptional 19.5% |
| Immigrants | Denmark | 100.0 /100 | #34 | Exceptional 19.5% |
| Immigrants | Northern Europe | 100.0 /100 | #35 | Exceptional 19.5% |
| Immigrants | Russia | 100.0 /100 | #36 | Exceptional 19.4% |
| Mongolians | 100.0 /100 | #37 | Exceptional 19.4% |
| Bolivians | 100.0 /100 | #38 | Exceptional 19.3% |
| Immigrants | Spain | 100.0 /100 | #39 | Exceptional 19.1% |
| Immigrants | Bolivia | 100.0 /100 | #40 | Exceptional 19.1% |
| Immigrants | Latvia | 100.0 /100 | #41 | Exceptional 19.1% |