Lebanese vs Immigrants from the Azores Master's Degree
COMPARE
Lebanese
Immigrants from the Azores
Master's Degree
Master's Degree Comparison
Lebanese
Immigrants from the Azores
16.5%
MASTER'S DEGREE
96.4/ 100
METRIC RATING
120th/ 347
METRIC RANK
10.2%
MASTER'S DEGREE
0.0/ 100
METRIC RATING
332nd/ 347
METRIC RANK
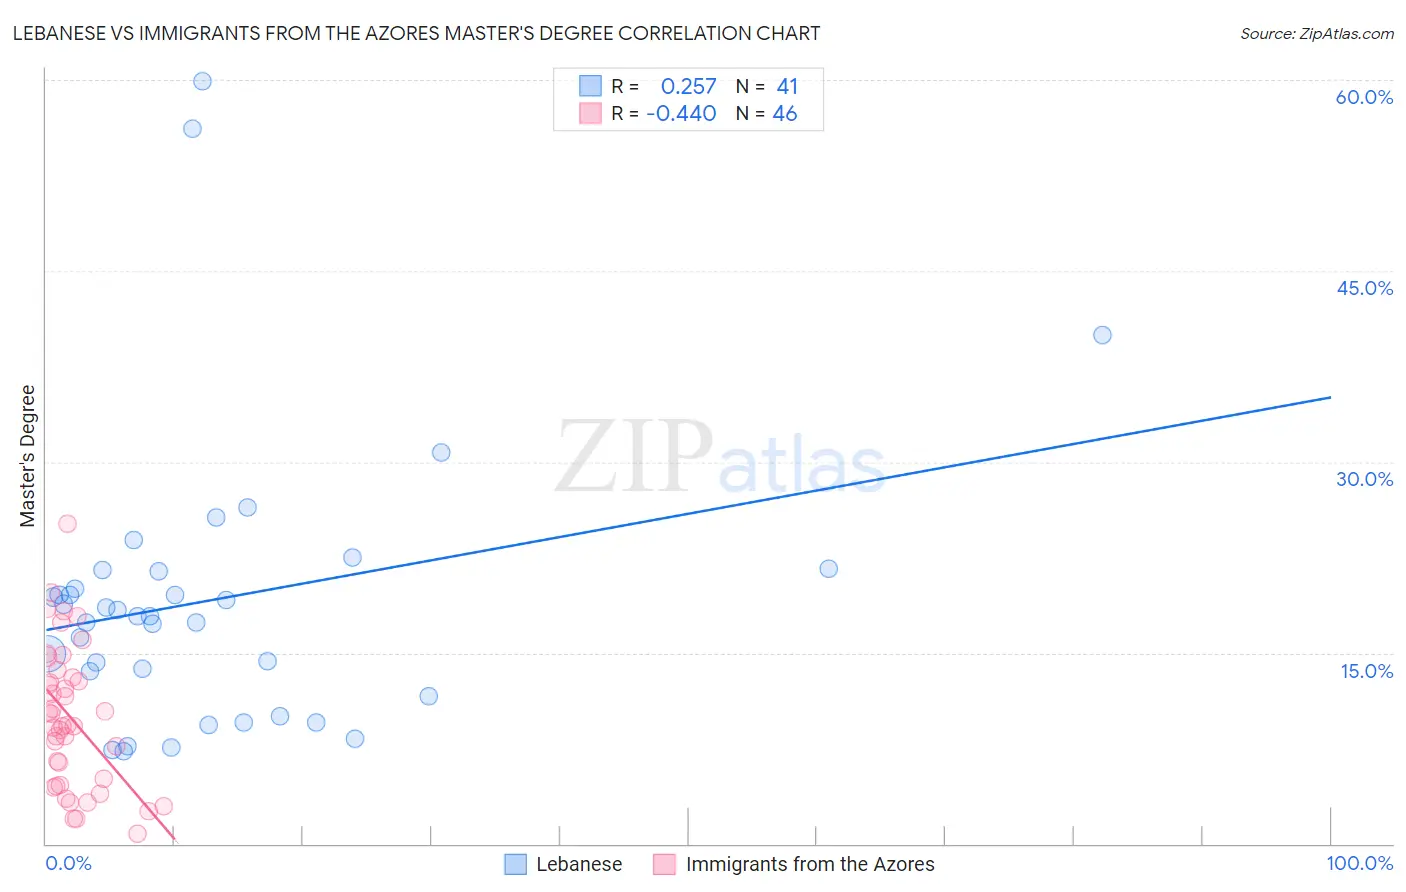
Lebanese vs Immigrants from the Azores Master's Degree Correlation Chart
The statistical analysis conducted on geographies consisting of 401,481,649 people shows a weak positive correlation between the proportion of Lebanese and percentage of population with at least master's degree education in the United States with a correlation coefficient (R) of 0.257 and weighted average of 16.5%. Similarly, the statistical analysis conducted on geographies consisting of 46,256,023 people shows a moderate negative correlation between the proportion of Immigrants from the Azores and percentage of population with at least master's degree education in the United States with a correlation coefficient (R) of -0.440 and weighted average of 10.2%, a difference of 61.3%.
Master's Degree Correlation Summary
| Measurement | Lebanese | Immigrants from the Azores |
| Minimum | 7.3% | 0.81% |
| Maximum | 60.0% | 25.2% |
| Range | 52.6% | 24.4% |
| Mean | 19.2% | 9.9% |
| Median | 17.9% | 9.3% |
| Interquartile 25% (IQ1) | 12.6% | 4.6% |
| Interquartile 75% (IQ3) | 21.4% | 13.1% |
| Interquartile Range (IQR) | 8.9% | 8.5% |
| Standard Deviation (Sample) | 11.2% | 5.6% |
| Standard Deviation (Population) | 11.0% | 5.5% |
Similar Demographics by Master's Degree
Demographics Similar to Lebanese by Master's Degree
In terms of master's degree, the demographic groups most similar to Lebanese are Jordanian (16.5%, a difference of 0.10%), Afghan (16.5%, a difference of 0.20%), Brazilian (16.5%, a difference of 0.33%), British (16.4%, a difference of 0.63%), and Croatian (16.4%, a difference of 0.64%).
| Demographics | Rating | Rank | Master's Degree |
| Arabs | 97.7 /100 | #113 | Exceptional 16.7% |
| Northern Europeans | 97.6 /100 | #114 | Exceptional 16.7% |
| Immigrants | Uganda | 97.3 /100 | #115 | Exceptional 16.6% |
| Immigrants | Southern Europe | 97.2 /100 | #116 | Exceptional 16.6% |
| Immigrants | Moldova | 97.2 /100 | #117 | Exceptional 16.6% |
| Brazilians | 96.8 /100 | #118 | Exceptional 16.5% |
| Jordanians | 96.5 /100 | #119 | Exceptional 16.5% |
| Lebanese | 96.4 /100 | #120 | Exceptional 16.5% |
| Afghans | 96.2 /100 | #121 | Exceptional 16.5% |
| British | 95.6 /100 | #122 | Exceptional 16.4% |
| Croatians | 95.6 /100 | #123 | Exceptional 16.4% |
| Immigrants | Eritrea | 95.5 /100 | #124 | Exceptional 16.4% |
| Italians | 95.4 /100 | #125 | Exceptional 16.4% |
| Immigrants | Eastern Africa | 95.2 /100 | #126 | Exceptional 16.3% |
| Palestinians | 94.8 /100 | #127 | Exceptional 16.3% |
Demographics Similar to Immigrants from the Azores by Master's Degree
In terms of master's degree, the demographic groups most similar to Immigrants from the Azores are Menominee (10.2%, a difference of 0.37%), Pueblo (10.3%, a difference of 0.46%), Fijian (10.3%, a difference of 0.63%), Arapaho (10.0%, a difference of 2.3%), and Nepalese (10.5%, a difference of 2.4%).
| Demographics | Rating | Rank | Master's Degree |
| Inupiat | 0.0 /100 | #325 | Tragic 10.5% |
| Creek | 0.0 /100 | #326 | Tragic 10.5% |
| Paiute | 0.0 /100 | #327 | Tragic 10.5% |
| Bangladeshis | 0.0 /100 | #328 | Tragic 10.5% |
| Nepalese | 0.0 /100 | #329 | Tragic 10.5% |
| Fijians | 0.0 /100 | #330 | Tragic 10.3% |
| Pueblo | 0.0 /100 | #331 | Tragic 10.3% |
| Immigrants | Azores | 0.0 /100 | #332 | Tragic 10.2% |
| Menominee | 0.0 /100 | #333 | Tragic 10.2% |
| Arapaho | 0.0 /100 | #334 | Tragic 10.0% |
| Immigrants | Central America | 0.0 /100 | #335 | Tragic 10.0% |
| Natives/Alaskans | 0.0 /100 | #336 | Tragic 9.9% |
| Mexicans | 0.0 /100 | #337 | Tragic 9.7% |
| Tohono O'odham | 0.0 /100 | #338 | Tragic 9.7% |
| Spanish American Indians | 0.0 /100 | #339 | Tragic 9.6% |