Immigrants from Barbados vs Immigrants from the Azores Master's Degree
COMPARE
Immigrants from Barbados
Immigrants from the Azores
Master's Degree
Master's Degree Comparison
Immigrants from Barbados
Immigrants from the Azores
14.3%
MASTER'S DEGREE
20.5/ 100
METRIC RATING
208th/ 347
METRIC RANK
10.2%
MASTER'S DEGREE
0.0/ 100
METRIC RATING
332nd/ 347
METRIC RANK
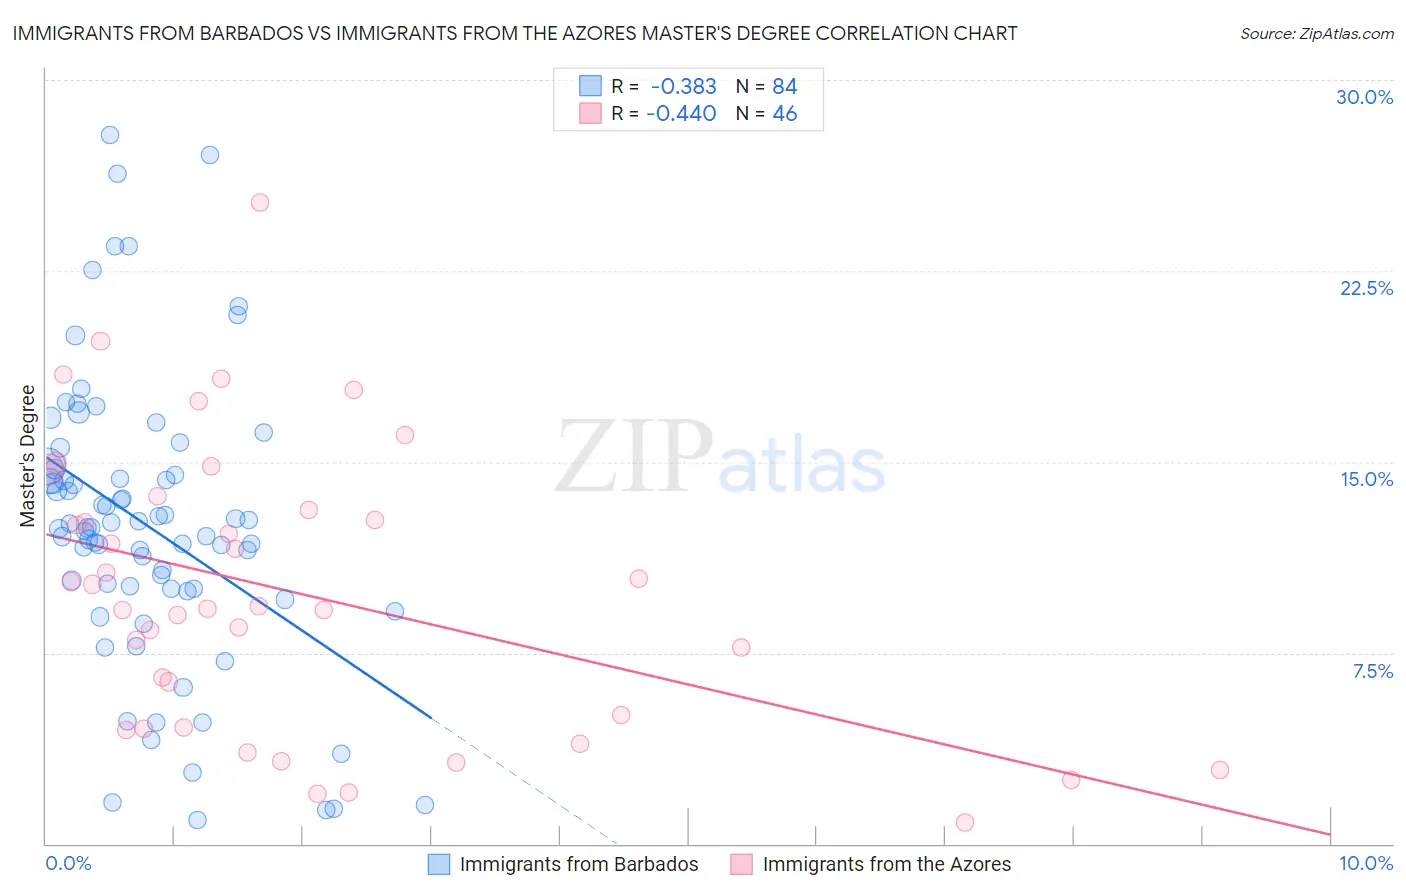
Immigrants from Barbados vs Immigrants from the Azores Master's Degree Correlation Chart
The statistical analysis conducted on geographies consisting of 112,776,866 people shows a mild negative correlation between the proportion of Immigrants from Barbados and percentage of population with at least master's degree education in the United States with a correlation coefficient (R) of -0.383 and weighted average of 14.3%. Similarly, the statistical analysis conducted on geographies consisting of 46,256,023 people shows a moderate negative correlation between the proportion of Immigrants from the Azores and percentage of population with at least master's degree education in the United States with a correlation coefficient (R) of -0.440 and weighted average of 10.2%, a difference of 39.5%.
Master's Degree Correlation Summary
| Measurement | Immigrants from Barbados | Immigrants from the Azores |
| Minimum | 0.92% | 0.81% |
| Maximum | 27.8% | 25.2% |
| Range | 26.9% | 24.4% |
| Mean | 12.5% | 9.9% |
| Median | 12.4% | 9.3% |
| Interquartile 25% (IQ1) | 10.0% | 4.6% |
| Interquartile 75% (IQ3) | 14.6% | 13.1% |
| Interquartile Range (IQR) | 4.6% | 8.5% |
| Standard Deviation (Sample) | 5.7% | 5.6% |
| Standard Deviation (Population) | 5.6% | 5.5% |
Similar Demographics by Master's Degree
Demographics Similar to Immigrants from Barbados by Master's Degree
In terms of master's degree, the demographic groups most similar to Immigrants from Barbados are Immigrants from Panama (14.3%, a difference of 0.090%), Subsaharan African (14.2%, a difference of 0.22%), Immigrants from Bosnia and Herzegovina (14.3%, a difference of 0.30%), Somali (14.2%, a difference of 0.53%), and Scandinavian (14.4%, a difference of 0.55%).
| Demographics | Rating | Rank | Master's Degree |
| Scotch-Irish | 25.0 /100 | #201 | Fair 14.4% |
| Immigrants | Western Africa | 24.9 /100 | #202 | Fair 14.4% |
| Yugoslavians | 24.3 /100 | #203 | Fair 14.4% |
| French | 23.7 /100 | #204 | Fair 14.4% |
| Trinidadians and Tobagonians | 23.5 /100 | #205 | Fair 14.4% |
| Scandinavians | 23.3 /100 | #206 | Fair 14.4% |
| Immigrants | Bosnia and Herzegovina | 22.0 /100 | #207 | Fair 14.3% |
| Immigrants | Barbados | 20.5 /100 | #208 | Fair 14.3% |
| Immigrants | Panama | 20.0 /100 | #209 | Fair 14.3% |
| Sub-Saharan Africans | 19.4 /100 | #210 | Poor 14.2% |
| Somalis | 18.0 /100 | #211 | Poor 14.2% |
| Spanish | 17.8 /100 | #212 | Poor 14.2% |
| Immigrants | Thailand | 17.0 /100 | #213 | Poor 14.2% |
| Finns | 16.9 /100 | #214 | Poor 14.2% |
| Immigrants | Vietnam | 16.1 /100 | #215 | Poor 14.1% |
Demographics Similar to Immigrants from the Azores by Master's Degree
In terms of master's degree, the demographic groups most similar to Immigrants from the Azores are Menominee (10.2%, a difference of 0.37%), Pueblo (10.3%, a difference of 0.46%), Fijian (10.3%, a difference of 0.63%), Arapaho (10.0%, a difference of 2.3%), and Nepalese (10.5%, a difference of 2.4%).
| Demographics | Rating | Rank | Master's Degree |
| Inupiat | 0.0 /100 | #325 | Tragic 10.5% |
| Creek | 0.0 /100 | #326 | Tragic 10.5% |
| Paiute | 0.0 /100 | #327 | Tragic 10.5% |
| Bangladeshis | 0.0 /100 | #328 | Tragic 10.5% |
| Nepalese | 0.0 /100 | #329 | Tragic 10.5% |
| Fijians | 0.0 /100 | #330 | Tragic 10.3% |
| Pueblo | 0.0 /100 | #331 | Tragic 10.3% |
| Immigrants | Azores | 0.0 /100 | #332 | Tragic 10.2% |
| Menominee | 0.0 /100 | #333 | Tragic 10.2% |
| Arapaho | 0.0 /100 | #334 | Tragic 10.0% |
| Immigrants | Central America | 0.0 /100 | #335 | Tragic 10.0% |
| Natives/Alaskans | 0.0 /100 | #336 | Tragic 9.9% |
| Mexicans | 0.0 /100 | #337 | Tragic 9.7% |
| Tohono O'odham | 0.0 /100 | #338 | Tragic 9.7% |
| Spanish American Indians | 0.0 /100 | #339 | Tragic 9.6% |